Test UNIQUE with a Random Forest regressor on the California Housing dataset#
In this Notebook, we showcase how to use UNIQUE to assess the uncertainty quantification methods for a random forest (RF) regressor and a multilayer perceptron (MLP), both trained on the California Housing dataset provided by scikit-learn package.
As uncertainty quantification methods based on models, we derive the variance of the predictions from 8 trees for the RF and the Monte Carlo dropout for the MLP.
The UNIQUE pipeline has been set with the following parameters:
Regression Task
UQ metrics:
Ensemble Variance (from the property model output)
ManhattanDistance
EuclideanDistance
Error model:
UniqueRandomForestRegressor
UniqueLASSO
UNIQUE Input data generation#
import json
import os
import yaml
from pathlib import Path

import numpy as np
import pandas as pd

# Install torch to prepare the California Housing data
try:
    import torch
except ImportError:
    # Replace with conda if mamba not available
    # %mamba install pytorch::pytorch -y
    %pip install torch --index-url https://download.pytorch.org/whl/cpu

from unique import Pipeline

# Set the project's directory
PROJECT_PATH = os.environ.get("PROJECT_PATH", os.path.abspath("")) # ALTERNATIVELY, REPLACE `os.path.abspath("")` WITH YOUR PATH TO THE SYNTHETIC EXAMPLE FOLDER
%cd $PROJECT_PATH

from preparation import SyntheticDataExamplePreparation
Looking in indexes: https://download.pytorch.org/whl/cpu
Collecting torch
Downloading https://download.pytorch.org/whl/cpu/torch-2.4.1%2Bcpu-cp312-cp312-linux_x86_64.whl (194.8 MB)
?25l     ━━━━━━━━━━━━━━━━━━━━━━━━━━━━━━━━━━━━━━━━ 0.0/194.8 MB ? eta -:--:--
     ━━━━━━━━━━━╺━━━━━━━━━━━━━━━━━━━━━━━━━━ 57.9/194.8 MB 300.4 MB/s eta 0:00:01
     ━━━━━━━━━━━━━━━━━━━━━━━━╺━━━━━━━━━━━━ 128.7/194.8 MB 326.2 MB/s eta 0:00:01
     ━━━━━━━━━━━━━━━━━━━━━━━━━━━━━━━━━━━━╸ 194.8/194.8 MB 336.0 MB/s eta 0:00:01
     ━━━━━━━━━━━━━━━━━━━━━━━━━━━━━━━━━━━━╸ 194.8/194.8 MB 336.0 MB/s eta 0:00:01
     ━━━━━━━━━━━━━━━━━━━━━━━━━━━━━━━━━━━━━ 194.8/194.8 MB 205.5 MB/s eta 0:00:00
?25h
Requirement already satisfied: filelock in /home/runner/work/UNIQUE/UNIQUE/.conda/unique/lib/python3.12/site-packages (from torch) (3.16.1)
Requirement already satisfied: typing-extensions>=4.8.0 in /home/runner/work/UNIQUE/UNIQUE/.conda/unique/lib/python3.12/site-packages (from torch) (4.12.2)
Collecting sympy (from torch)
  Downloading https://download.pytorch.org/whl/sympy-1.12-py3-none-any.whl (5.7 MB)
     ━━━━━━━━━━━━━━━━━━━━━━━━━━━━━━━━━━━━━━━━ 5.7/5.7 MB 182.0 MB/s eta 0:00:00
?25h
Collecting networkx (from torch)
Downloading https://download.pytorch.org/whl/networkx-3.2.1-py3-none-any.whl (1.6 MB)
     ━━━━━━━━━━━━━━━━━━━━━━━━━━━━━━━━━━━━━━━━ 1.6/1.6 MB 157.6 MB/s eta 0:00:00
?25hRequirement already satisfied: jinja2 in /home/runner/work/UNIQUE/UNIQUE/.conda/unique/lib/python3.12/site-packages (from torch) (3.1.3)
Collecting fsspec (from torch)
  Downloading https://download.pytorch.org/whl/fsspec-2024.2.0-py3-none-any.whl (170 kB)
Requirement already satisfied: setuptools in /home/runner/work/UNIQUE/UNIQUE/.conda/unique/lib/python3.12/site-packages (from torch) (75.1.0)
Requirement already satisfied: MarkupSafe>=2.0 in /home/runner/work/UNIQUE/UNIQUE/.conda/unique/lib/python3.12/site-packages (from jinja2->torch) (2.1.5)
Collecting mpmath>=0.19 (from sympy->torch)
  Downloading https://download.pytorch.org/whl/mpmath-1.3.0-py3-none-any.whl (536 kB)
?25l     ━━━━━━━━━━━━━━━━━━━━━━━━━━━━━━━━━━━━━━━━ 0.0/536.2 kB ? eta -:--:--
     ━━━━━━━━━━━━━━━━━━━━━━━━━━━━━━━━━━━━━━ 536.2/536.2 kB 71.8 MB/s eta 0:00:00
?25h
Installing collected packages: mpmath, sympy, networkx, fsspec, torch
Successfully installed fsspec-2024.2.0 mpmath-1.3.0 networkx-3.2.1 sympy-1.12 torch-2.4.1+cpu
Note: you may need to restart the kernel to use updated packages.
/home/runner/work/UNIQUE/UNIQUE/notebooks/california_housing
unique_input_data_path = f'{PROJECT_PATH}/unique_input_data.json'

s = SyntheticDataExamplePreparation()

if Path(unique_input_data_path).is_file():
    print('UNIQUE input data already generated.')
else:
    train_indices, val_indices, test_indices, \
    X_train, X_val, X_test, y_train, y_val, y_test, \
    rf_all_predictions, rf_variances, \
    mlp_all_predictions, mlp_variances = s.run()

    unique_dict = {
        'ID': np.concatenate([train_indices, val_indices, test_indices]).tolist(),
        'feature': [X_train[i, :].tolist() for i in range(X_train.shape[0])] +
                    [X_val[i, :].tolist() for i in range(X_val.shape[0])] +
                    [X_test[i, :].tolist() for i in range(X_test.shape[0])],
        'label': np.concatenate([y_train, y_val, y_test]).tolist(),
        'which_set': ['TRAIN'] * len(train_indices) +
                    ['CALIBRATION'] * len(val_indices) +
                    ['TEST'] * len(test_indices),
        'rf_predictions': rf_all_predictions.tolist(),
        'rf_variances': rf_variances,
        'mlp_predictions': mlp_all_predictions.detach().squeeze().numpy().tolist(),
        'mlp_variances': mlp_variances.tolist()
    }


    with open(unique_input_data_path, 'w') as f:
        json.dump(unique_dict, f)
RF training...
Random Forest Test performance:
MAE: 0.3653
RMSE: 0.5515
R2: 0.7729

MLP training...
Epoch: 0 | train_loss: 1.219 | val_loss: 0.450
Epoch: 1 | train_loss: 0.674 | val_loss: 0.413
Epoch: 2 | train_loss: 0.611 | val_loss: 0.378
Epoch: 3 | train_loss: 0.582 | val_loss: 0.391
Epoch: 4 | train_loss: 0.539 | val_loss: 0.357
Epoch: 5 | train_loss: 0.518 | val_loss: 0.367
Epoch: 6 | train_loss: 0.494 | val_loss: 0.364
Epoch: 7 | train_loss: 0.477 | val_loss: 0.338
Epoch: 8 | train_loss: 0.456 | val_loss: 0.330
Epoch: 9 | train_loss: 0.449 | val_loss: 0.325
MLP Test performance:
MAE: 0.3879
RMSE: 0.5503
R2: 0.7739

Collecting RF variance...
Dropout Monte Carlo...:   0%|          | 0/100 [00:00<?, ?it/s]
Dropout Monte Carlo...:   9%|▉         | 9/100 [00:00<00:01, 86.37it/s]
Dropout Monte Carlo...:  18%|█▊        | 18/100 [00:00<00:00, 86.32it/s]
Dropout Monte Carlo...:  27%|██▋       | 27/100 [00:00<00:00, 85.91it/s]
Dropout Monte Carlo...:  36%|███▌      | 36/100 [00:00<00:00, 86.41it/s]
Dropout Monte Carlo...:  45%|████▌     | 45/100 [00:00<00:00, 86.76it/s]
Dropout Monte Carlo...:  54%|█████▍    | 54/100 [00:00<00:00, 86.99it/s]
Dropout Monte Carlo...:  63%|██████▎   | 63/100 [00:00<00:00, 86.69it/s]
Dropout Monte Carlo...:  72%|███████▏  | 72/100 [00:00<00:00, 86.79it/s]
Dropout Monte Carlo...:  81%|████████  | 81/100 [00:00<00:00, 86.81it/s]
Dropout Monte Carlo...:  90%|█████████ | 90/100 [00:01<00:00, 86.76it/s]
Dropout Monte Carlo...:  99%|█████████▉| 99/100 [00:01<00:00, 84.73it/s]
Dropout Monte Carlo...: 100%|██████████| 100/100 [00:01<00:00, 85.99it/s]
UNIQUE Pipeline#
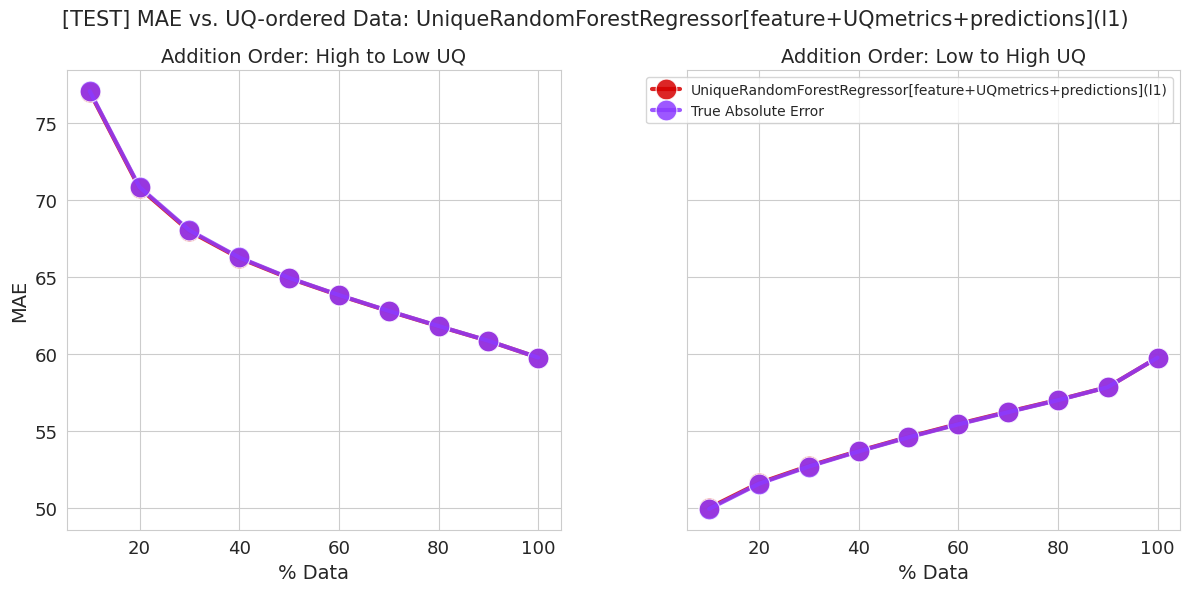
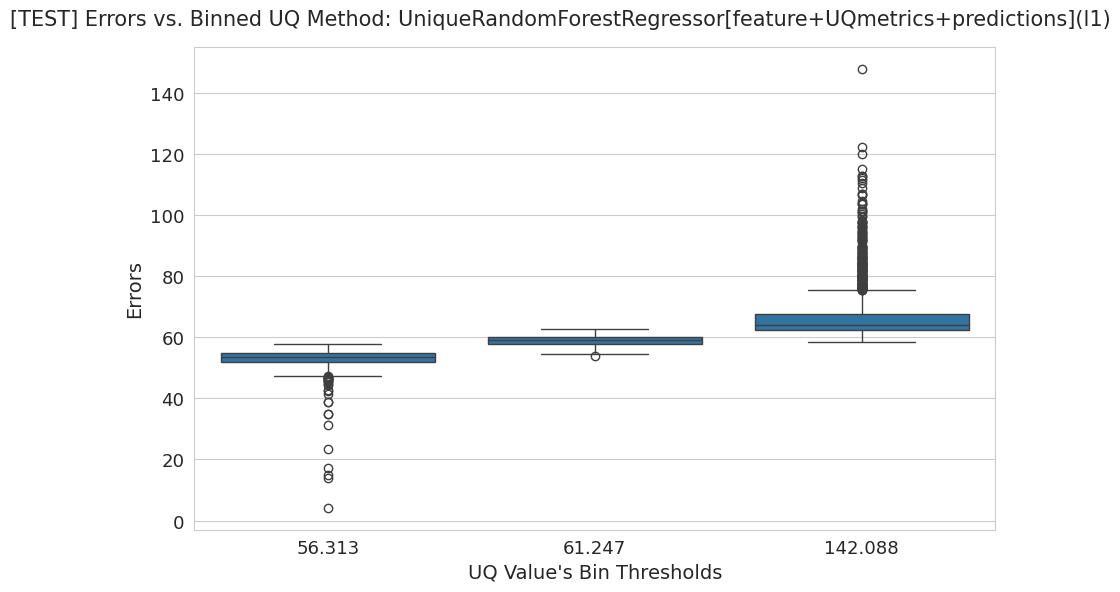
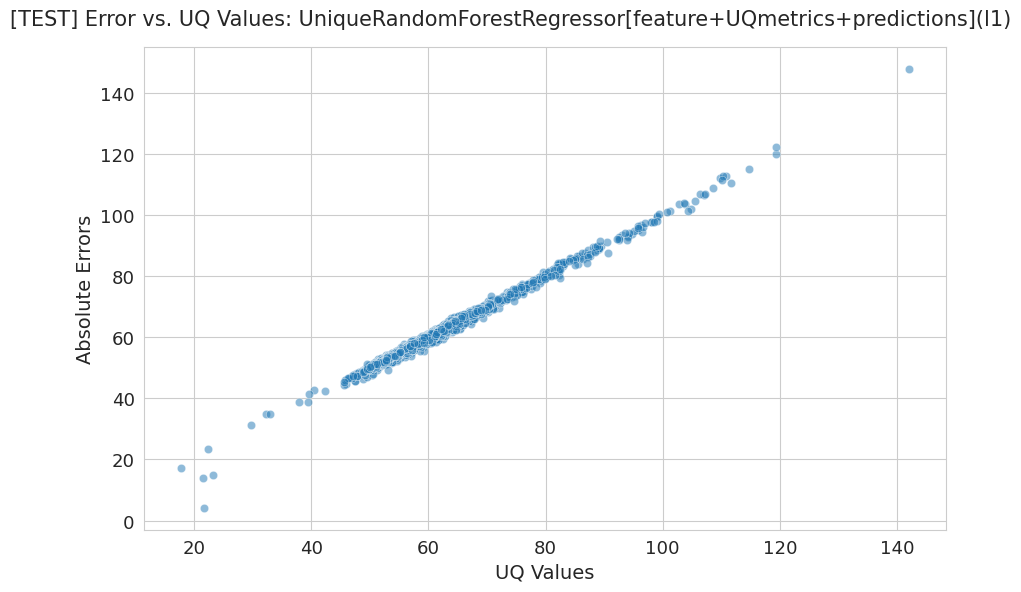
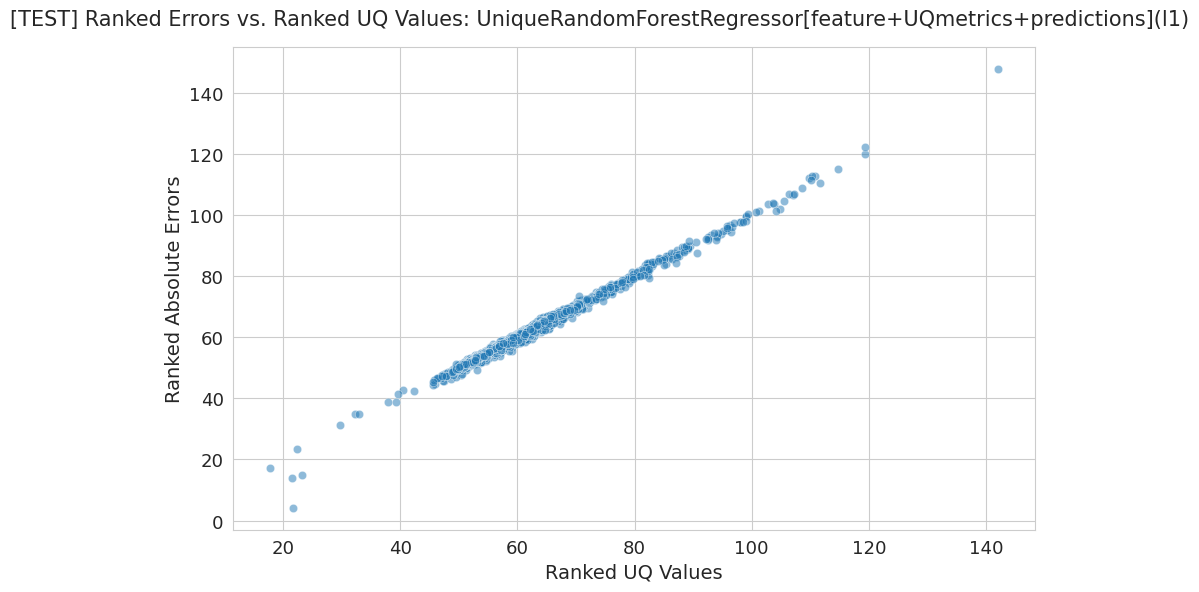
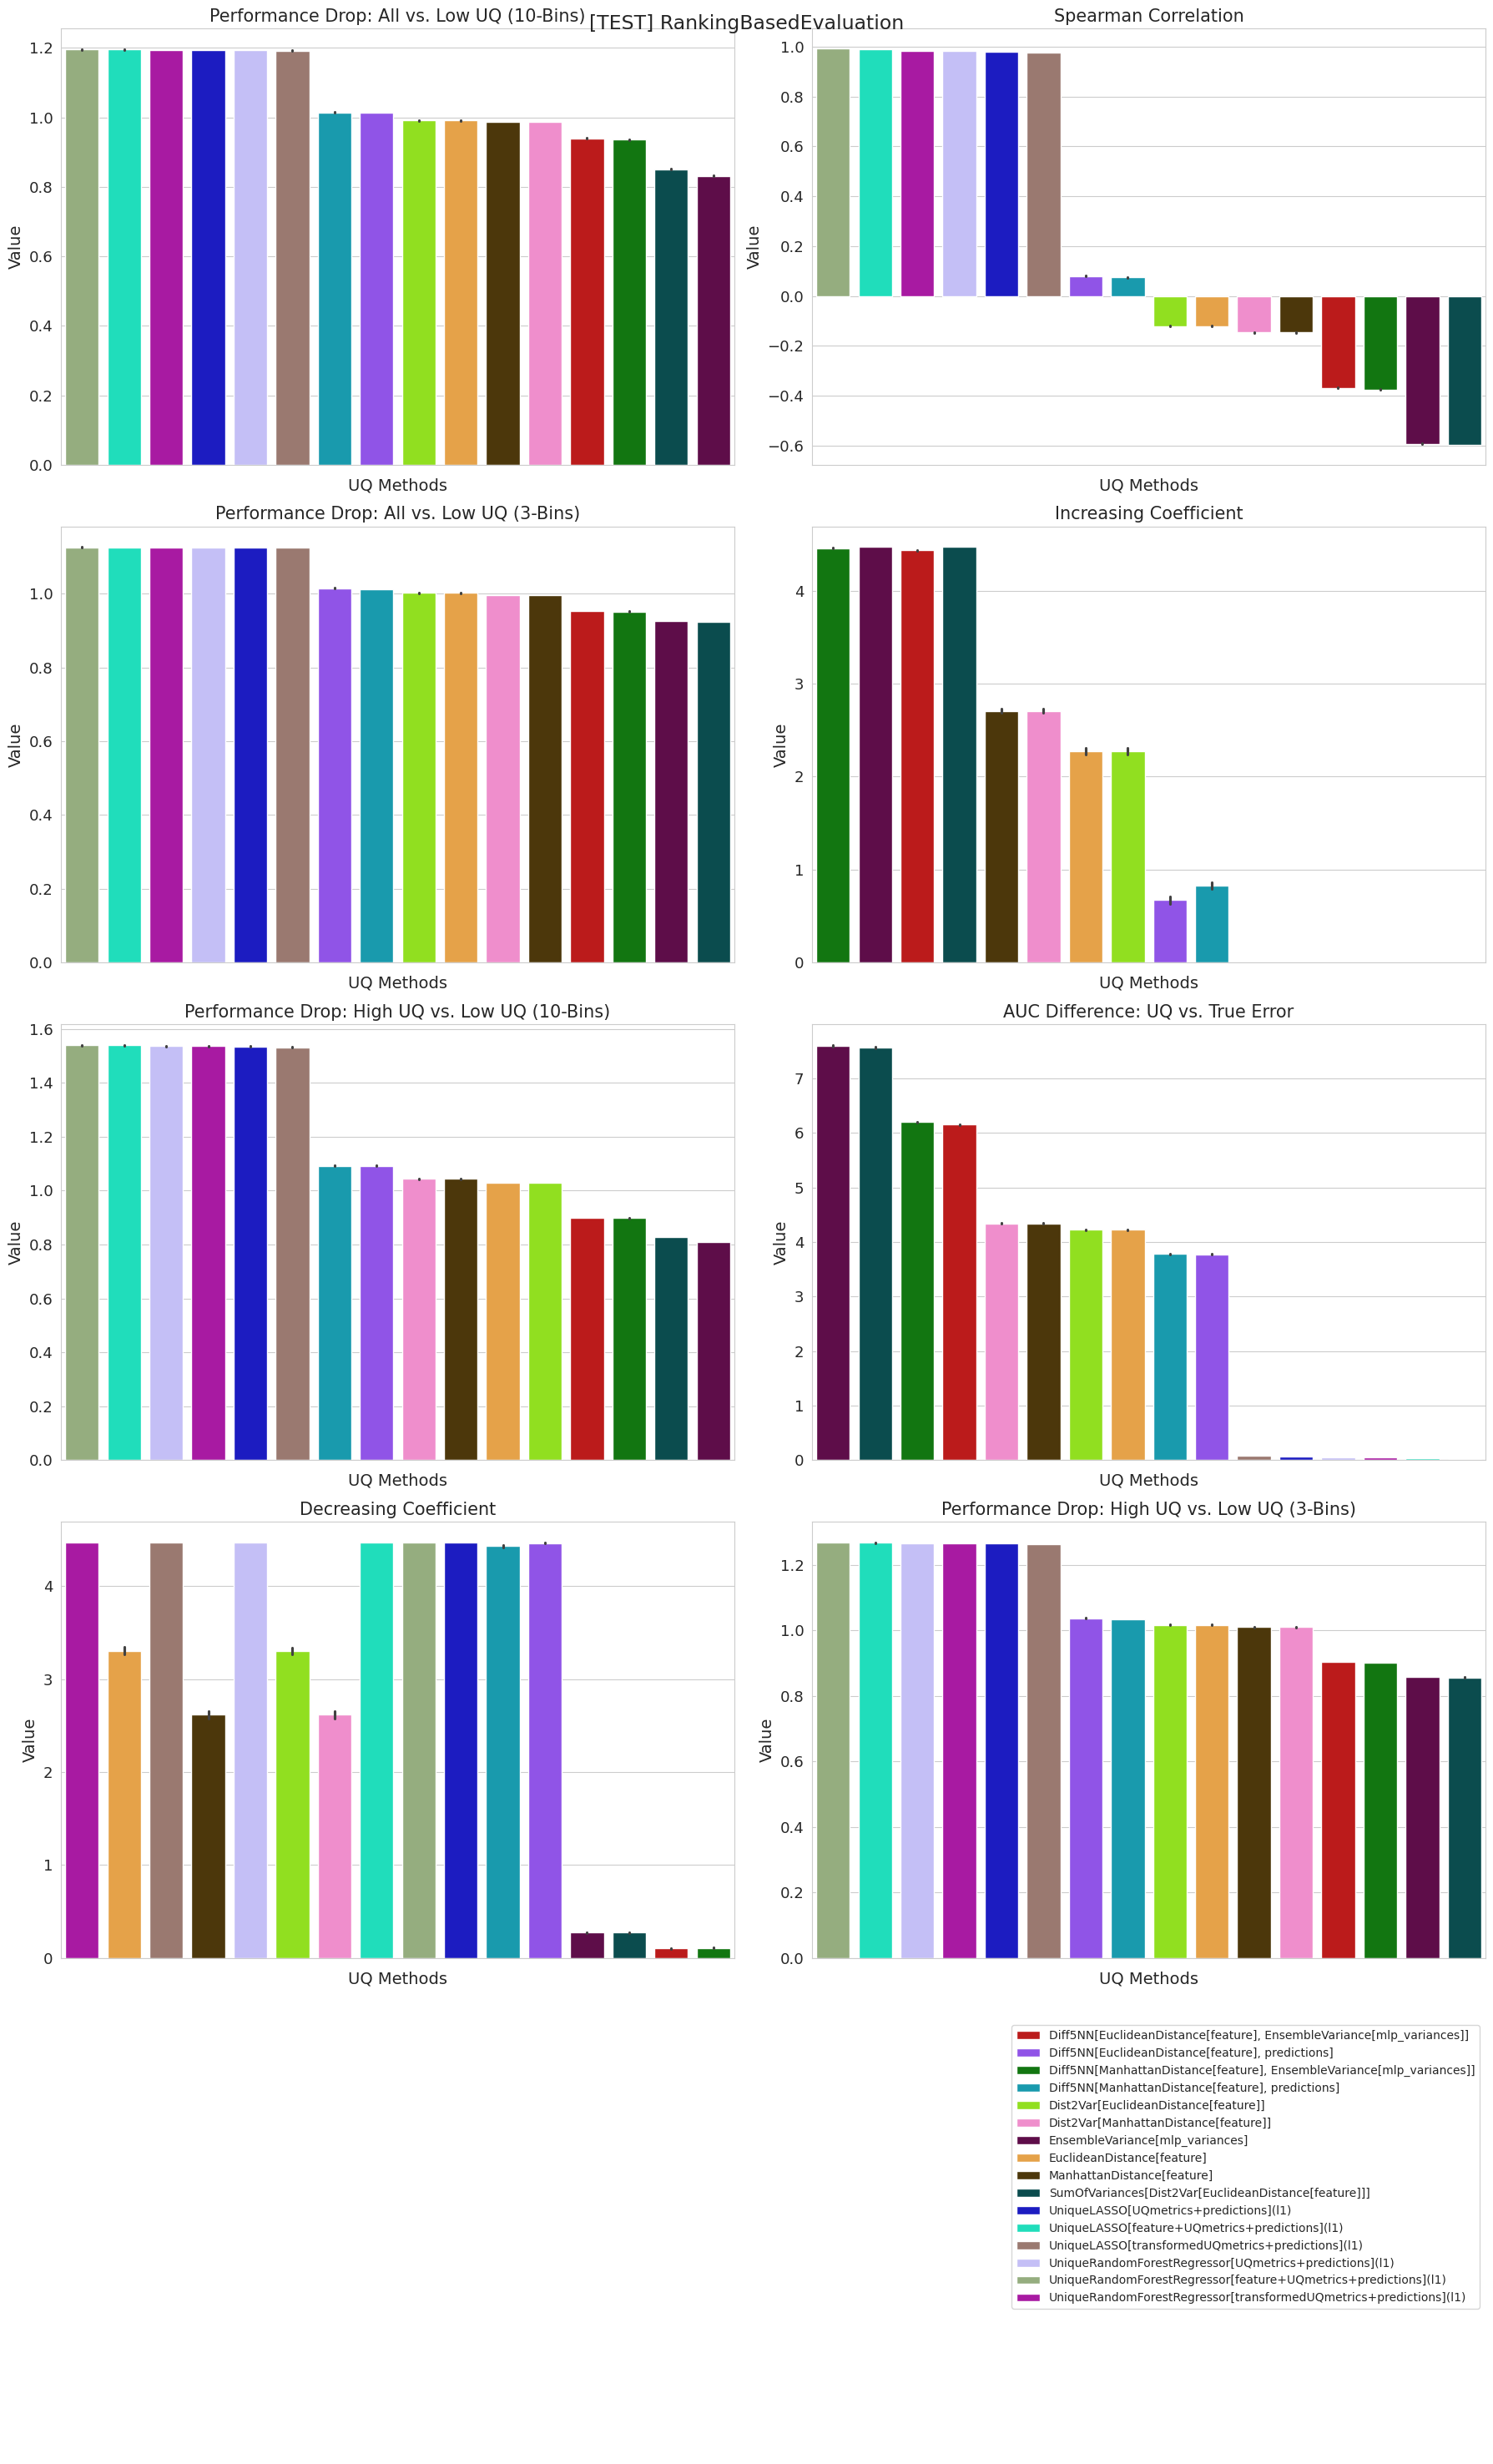
To evaluate the UQ methods of interest, including an additional set of UQ methods generated by the UNIQUE pipeline, you can run the fit() method of the pipeline. This will allow you to assess their performance using three main UQ evaluation types: Ranking, Proper scoring rules, and Calibration curves.
The summary tables provide scores for each UQ method based on a set of UQ evaluation metrics that are indicative of each evaluation type. The UQ method with the highest score is highlighted in green, indicating it as the best performing method.
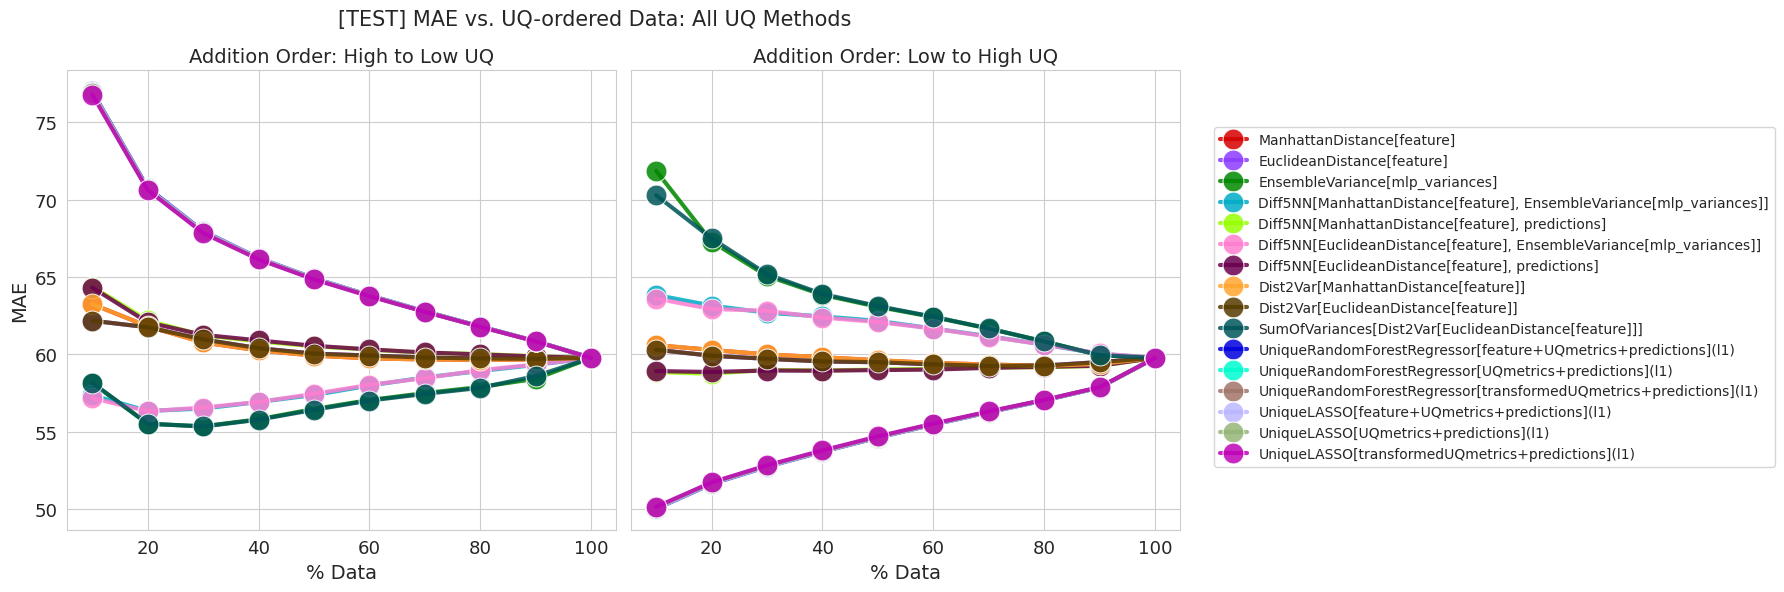
Following the summary tables, you will find individual plots showcasing the performance of the best UQ methods.
Additionally, you can explore the summary plots generated for all the evaluated UQ methods, providing a comprehensive overview of their performance.
def overwrite_paths(yaml_file: str, project_path: str, input_data_file: str = "unique_input_data.json"):
	"""Given a yaml UNIQUE config file, overwrite the `data_path` and `output_path` fields."""
	# Use ruamel.yaml to preserve comments
	from ruamel.yaml import YAML
	yaml = YAML()

	# Read
	with open(yaml_file, "r") as f:
		# If you want the equivalent of yaml.safe_load use `typ="safe"`
		config = yaml.load(f) # defaults to `typ="rt"` (round-trip) argument.

	# Overwrite
	config["data_path"] = os.path.join(project_path, input_data_file)
	config["output_path"] = os.path.join(project_path, "output")

	# Save
	with open(yaml_file, "w") as f:
		yaml.dump(config, f)
config_file = f'{PROJECT_PATH}/config_mlp.yaml'

# Replace `data_path` and `output_path` to be able run the notebook automatically
overwrite_paths(config_file, PROJECT_PATH) # COMMENT TO DISABLE OVERWRITING

pipeline = Pipeline.from_config(config_file)

# Compute UQ metrics, train error models (if any), evaluate UQ metrics
output, eval_results = pipeline.fit()
[2024-10-04 18:15:00] | [UNIQUE - INFO]: ************************ UNIQUE - INITIALIZING PIPELINE ************************
[2024-10-04 18:15:00] | [UNIQUE - INFO]: Loaded Pipeline configuration from: 'config_mlp.yaml'
[2024-10-04 18:15:00] | [UNIQUE - INFO]: Loading data from 'unique_input_data.json'...
[2024-10-04 18:15:00] | [UNIQUE - INFO]: Dataset with 20640 entries correctly loaded.
[2024-10-04 18:15:00] | [UNIQUE - INFO]: UQ inputs initialization...
[2024-10-04 18:15:00] | [UNIQUE - INFO]: UQ inputs summary:
1. [Data-Based Feature] Column: 'feature' | UQ methods to compute: Manhattan Distance, Euclidean Distance
2. [Model-Based Feature] Column: 'mlp_variances' | UQ methods to compute: Ensemble Variance
[2024-10-04 18:15:00] | [UNIQUE - INFO]: Selected error model(s):
1. UniqueRandomForestRegressor
2. UniqueLASSO
[2024-10-04 18:15:00] | [UNIQUE - INFO]: ************************ UNIQUE - COMPUTING UQ METHODS *************************
[2024-10-04 18:15:00] | [UNIQUE - INFO]: Computing UQ methods for provided inputs...
[2024-10-04 18:15:00] | [UNIQUE - INFO]: Combining 'base' UQ methods and computing 'transformed' UQ methods...
[2024-10-04 18:15:01] | [UNIQUE - INFO]: Initializing error models...
[2024-10-04 18:15:01] | [UNIQUE - INFO]: Preparing error models inputs...
[2024-10-04 18:15:01] | [UNIQUE - INFO]: Training error models...
[2024-10-04 18:15:06] | [UNIQUE - INFO]: Collected and computed 16 UQ methods.
[2024-10-04 18:15:06] | [UNIQUE - INFO]: Note: UQ method 'SumOfVariancesAndDistances' summed the input variance(s) and the following distances (converted to variances):
1. Dist2Var[EuclideanDistance[feature]]
[2024-10-04 18:15:06] | [UNIQUE - INFO]: ************************ UNIQUE - EVALUATING UQ METHODS ************************
[2024-10-04 18:15:06] | [UNIQUE - INFO]: Evaluating and benchmarking 16 UQ methods by bootstrapping (n=500) on the test set...
[2024-10-04 18:18:52] | [UNIQUE - INFO]: Evaluated 5 UQ methods out of 16...
[2024-10-04 18:23:35] | [UNIQUE - INFO]: Evaluated 10 UQ methods out of 16...
[2024-10-04 18:29:21] | [UNIQUE - INFO]: Evaluated 15 UQ methods out of 16...
[2024-10-04 18:30:30] | [UNIQUE - INFO]: Evaluated 16 UQ methods out of 16.
[2024-10-04 18:30:31] | [UNIQUE - INFO]: Generating summary tables...
[2024-10-04 18:30:31] | [UNIQUE - INFO]: Summary evaluation tables saved to: .../california_housing/output/summary.
[2024-10-04 18:30:42] | [UNIQUE - INFO]: Generating summary plots...
[2024-10-04 18:30:56] | [UNIQUE - INFO]: Summary plots saved to: .../california_housing/output/summary.
[2024-10-04 18:30:56] | [UNIQUE - INFO]: Summary of best UQ method for each UQ evaluation type:
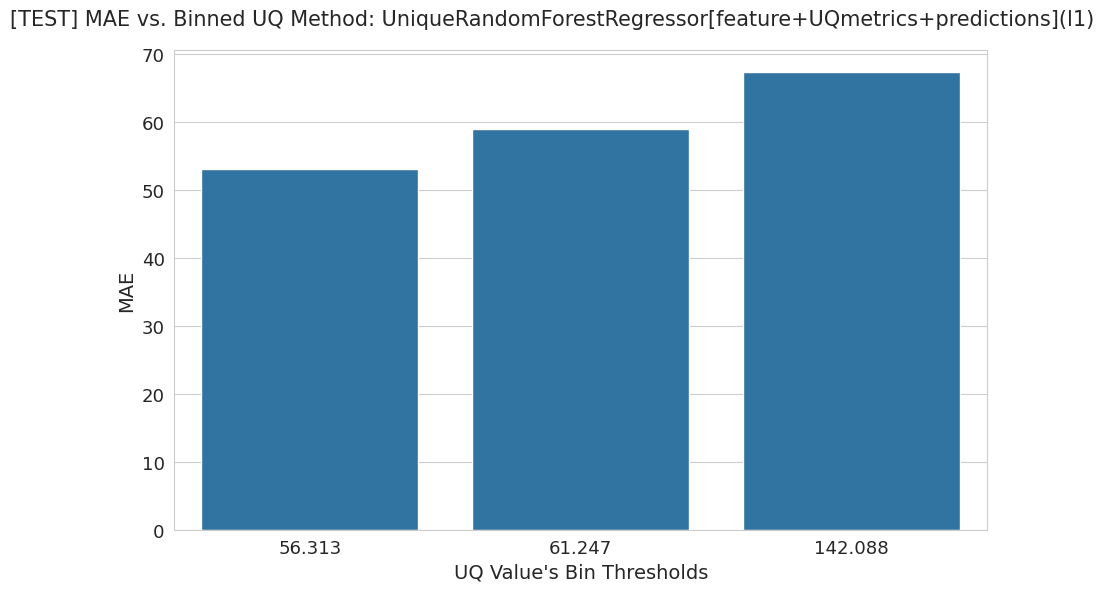
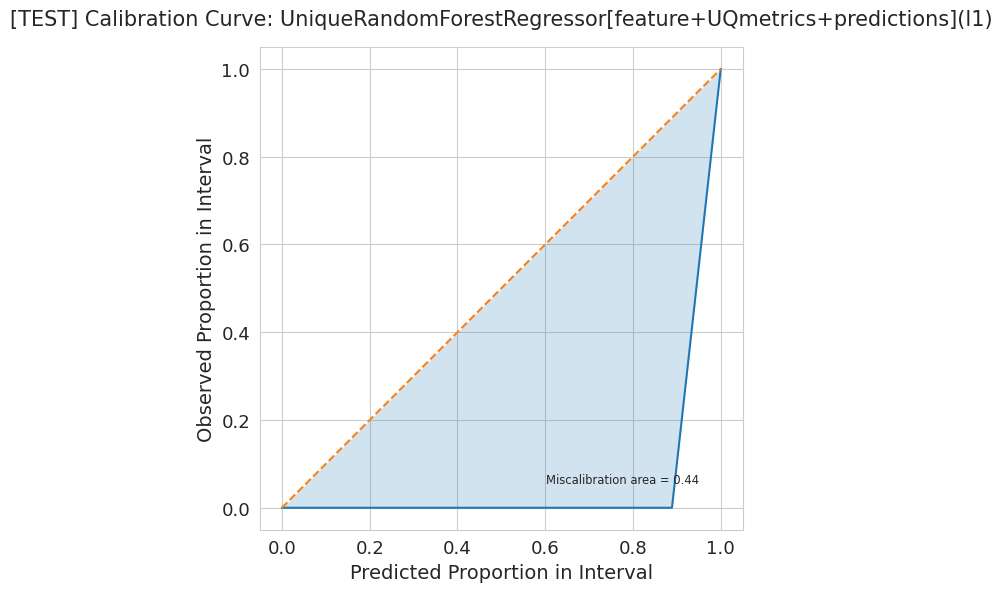
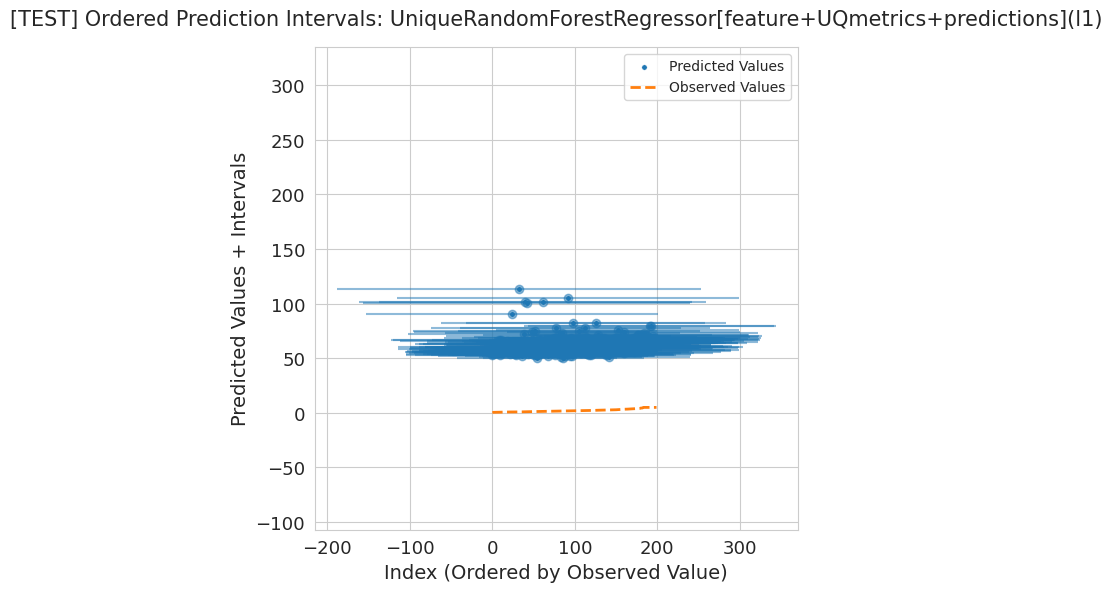
1. [TEST] RankingBasedEvaluation: UniqueRandomForestRegressor[feature+UQmetrics+predictions](l1)
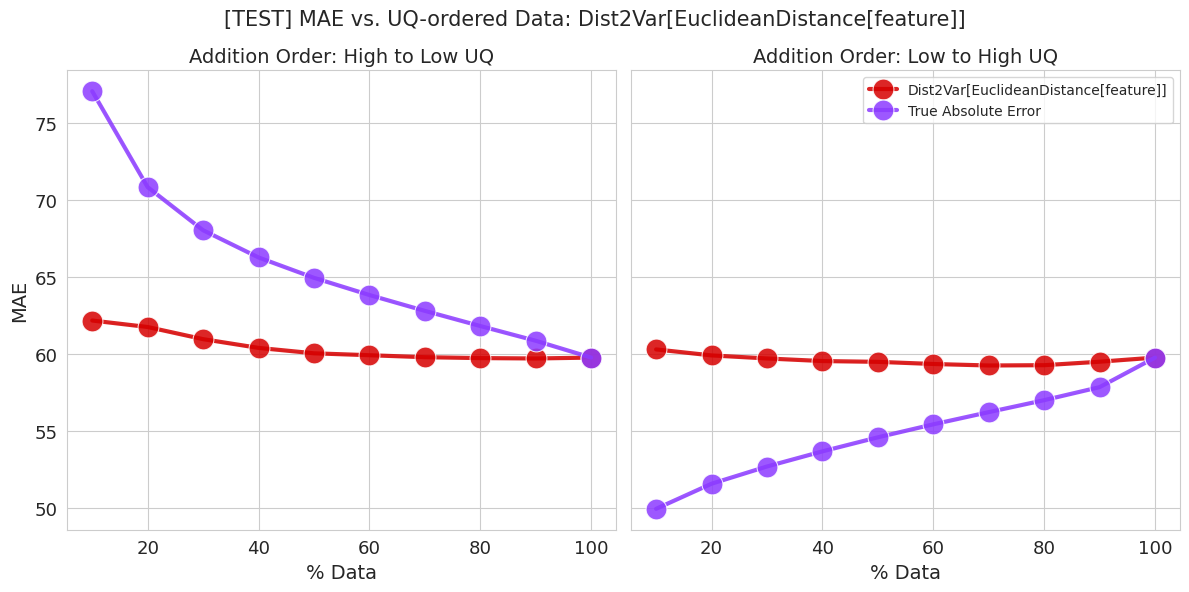
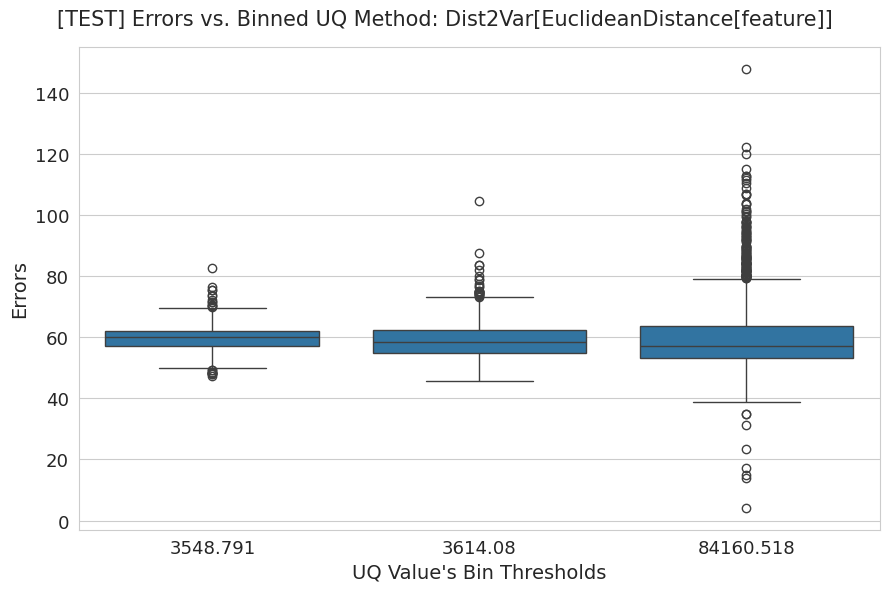
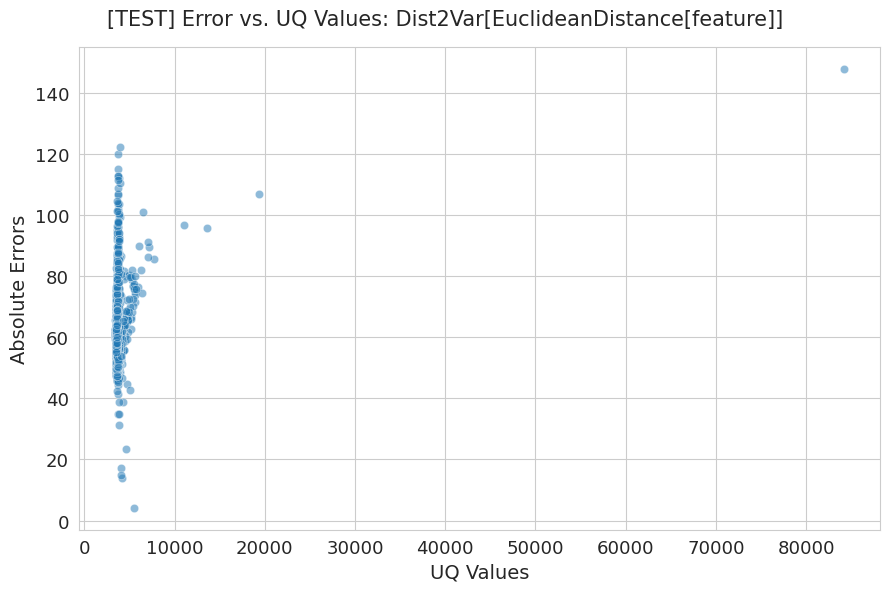
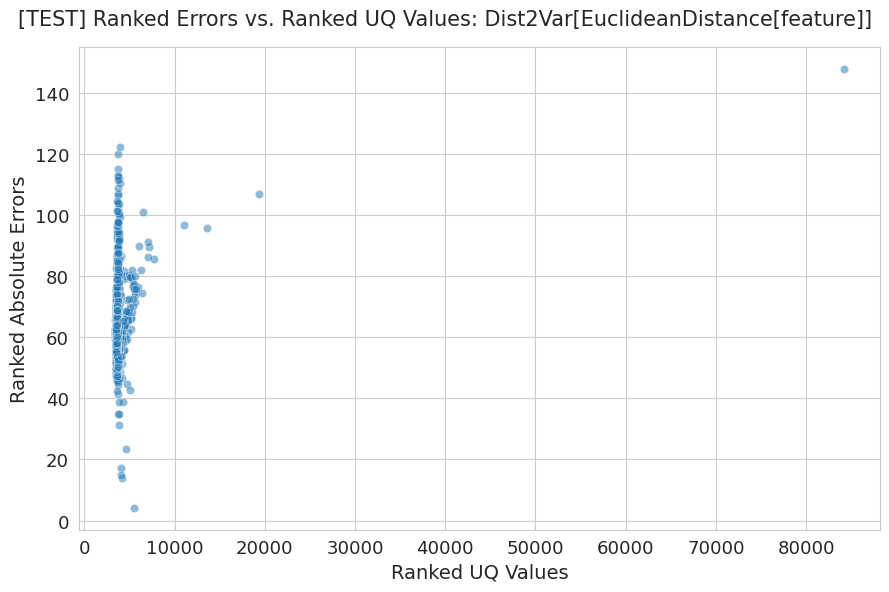
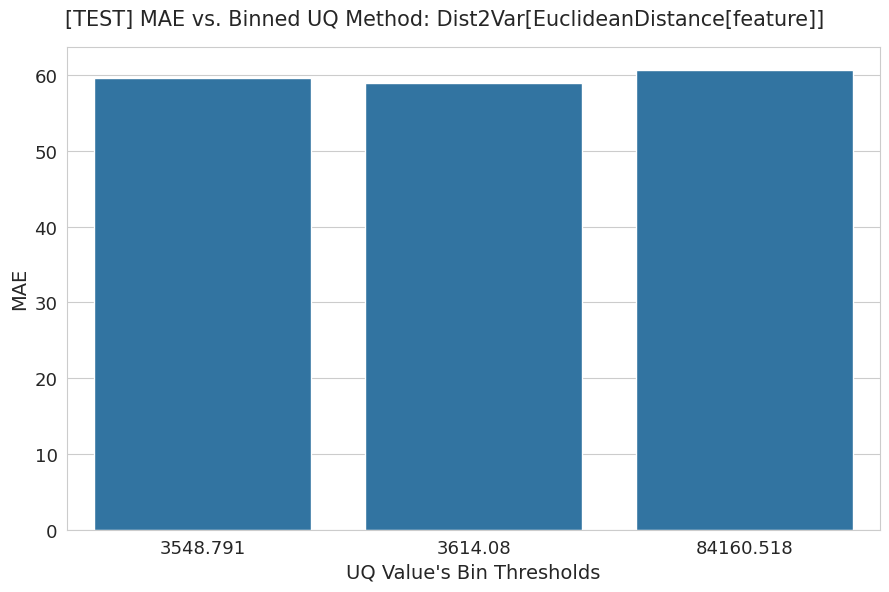
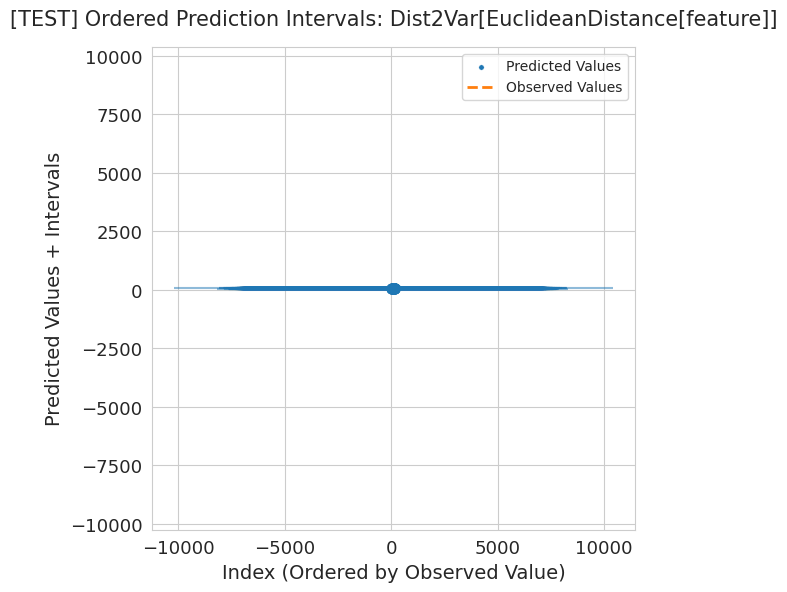
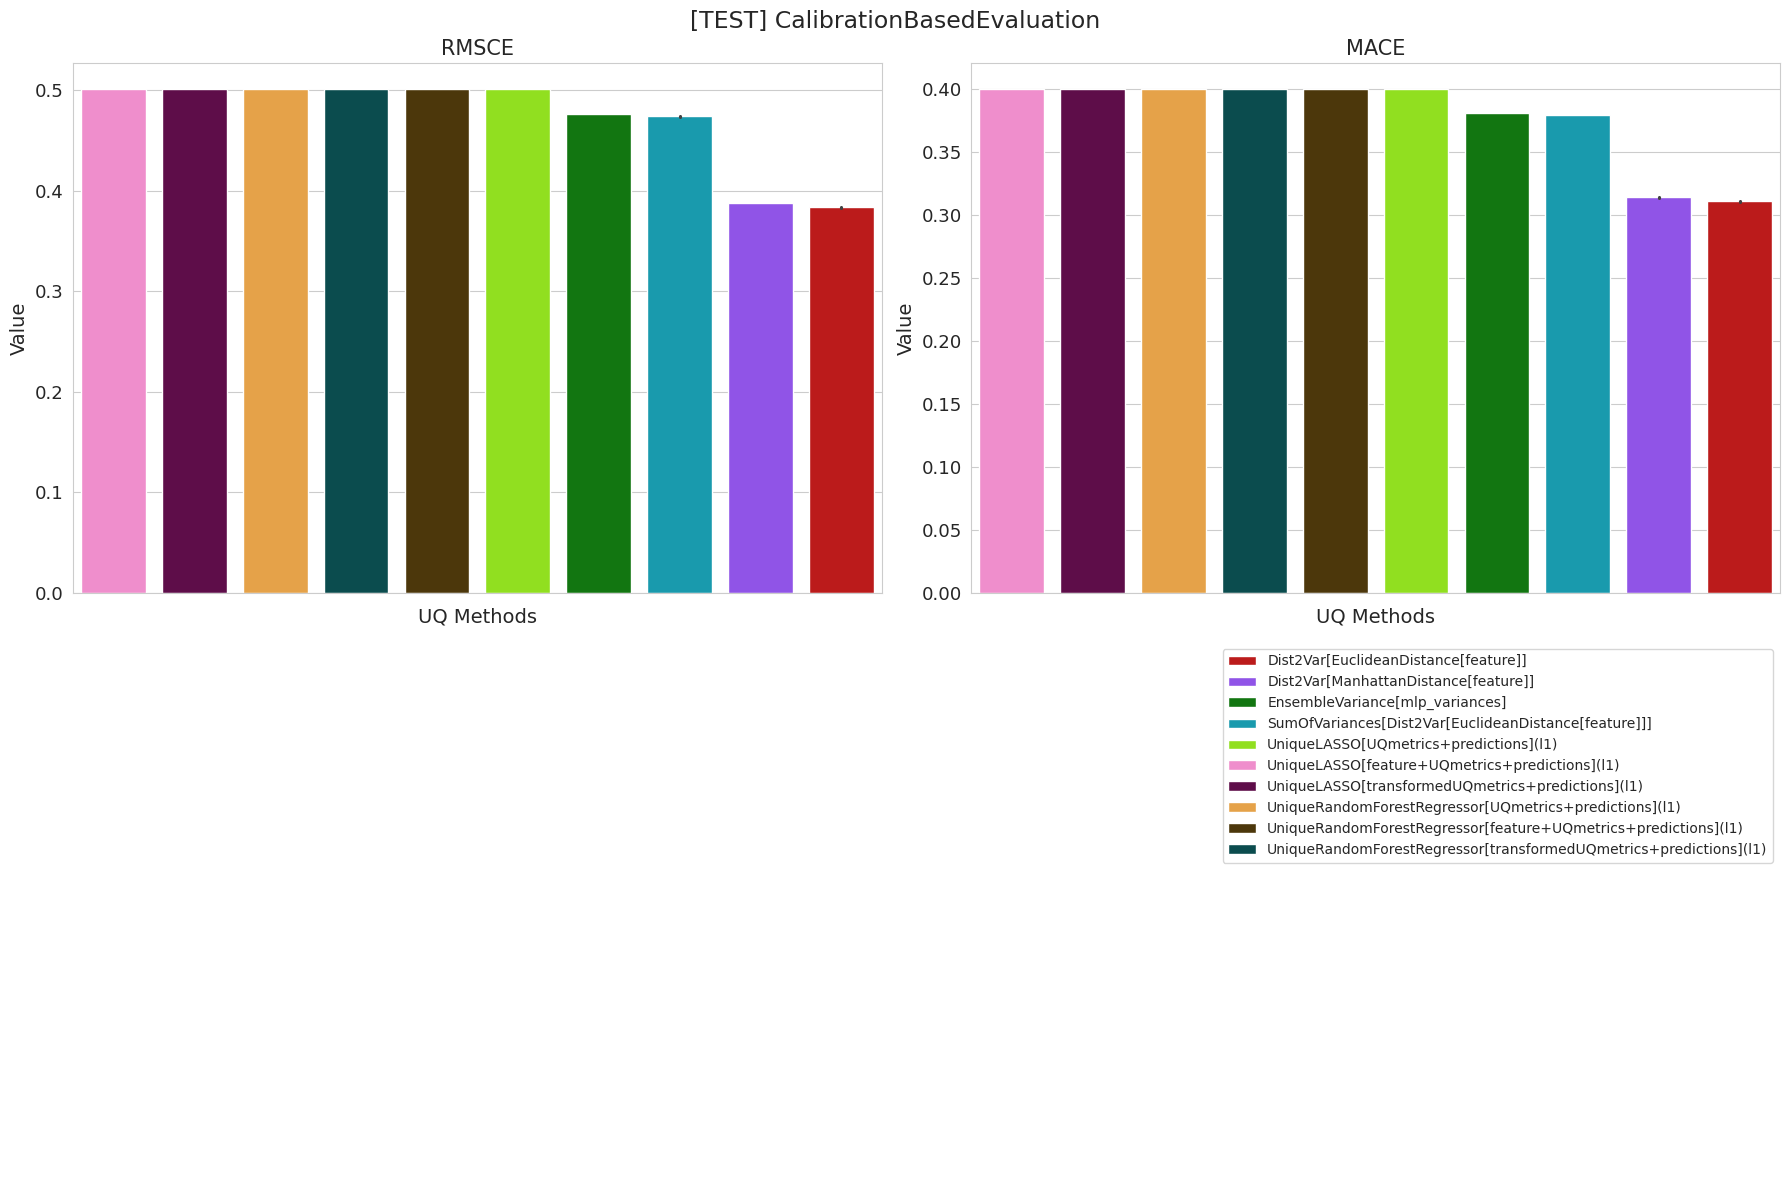
2. [TEST] CalibrationBasedEvaluation: Dist2Var[EuclideanDistance[feature]]
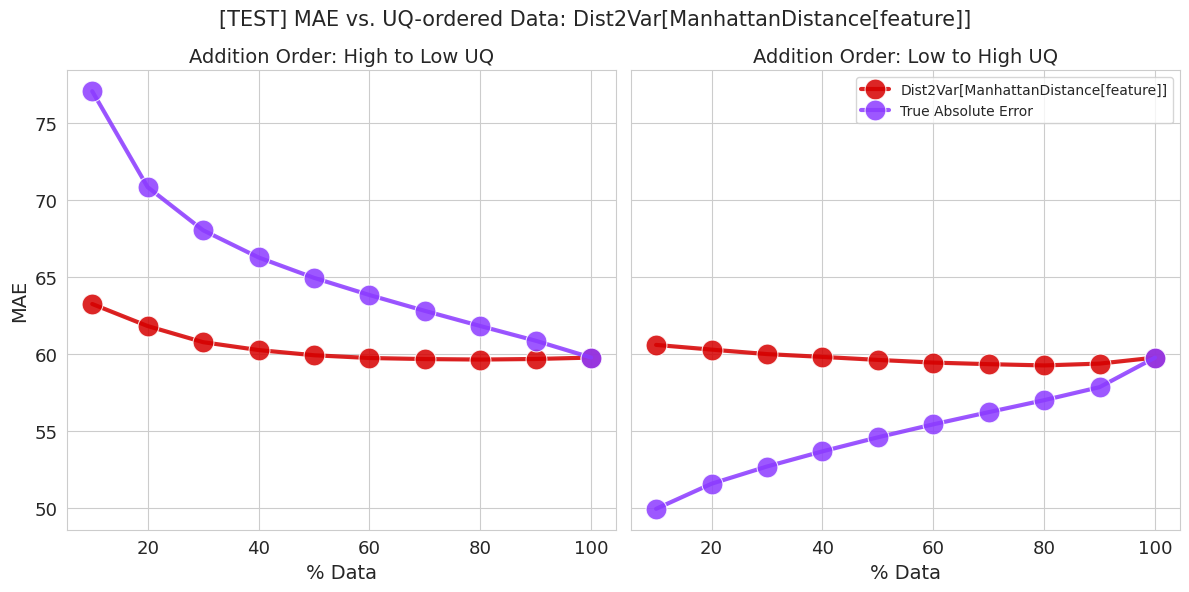
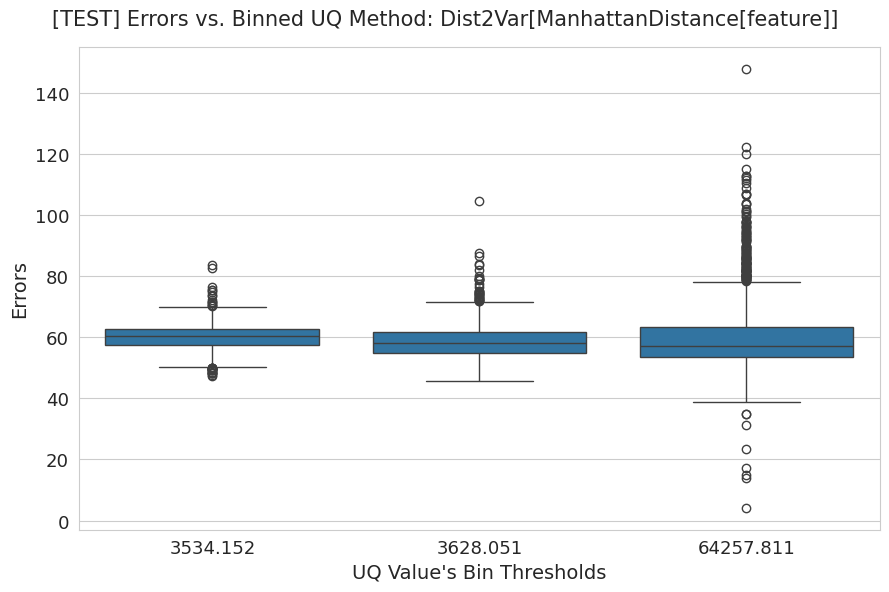
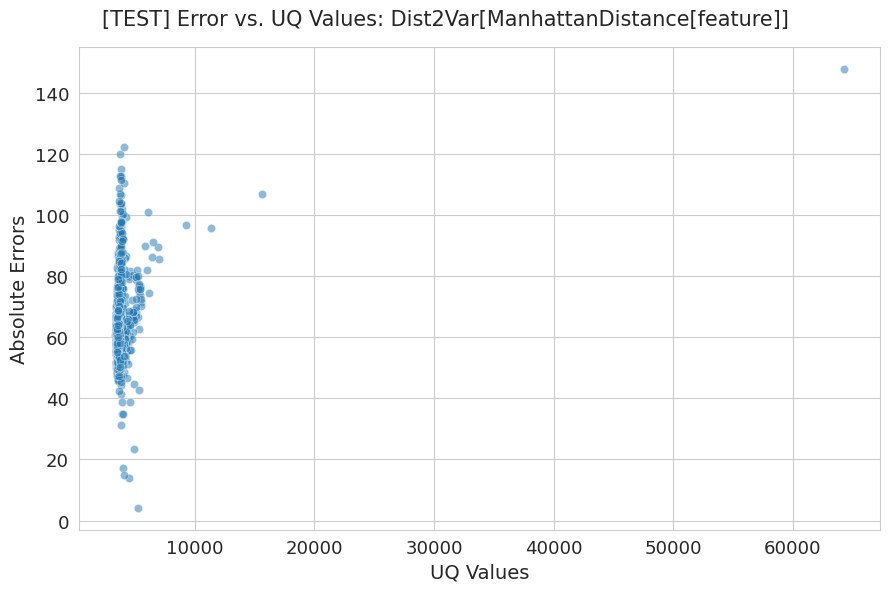
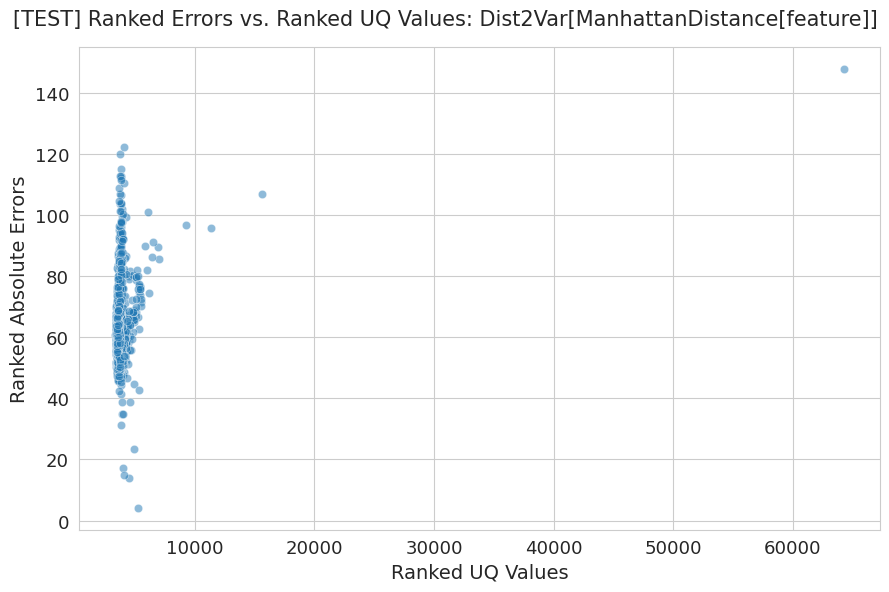
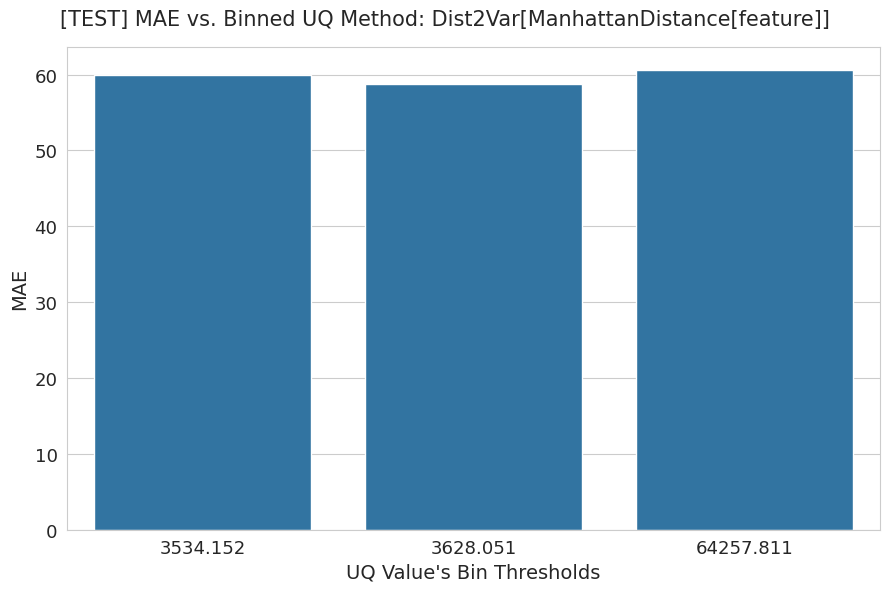
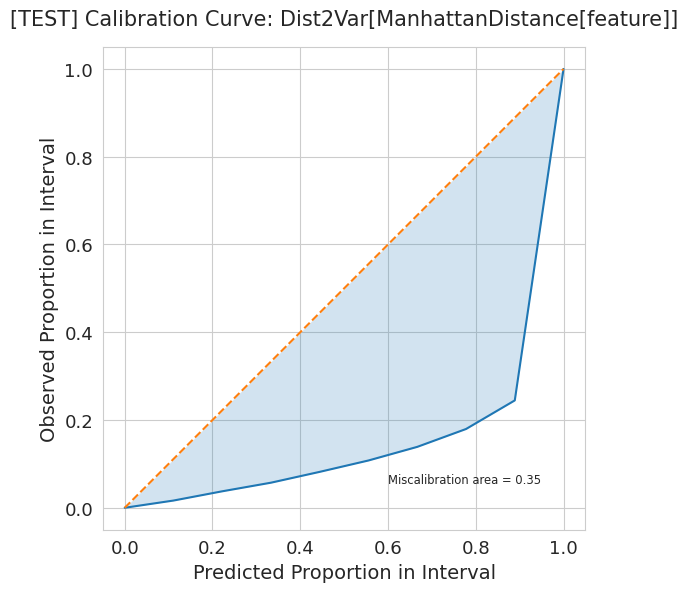
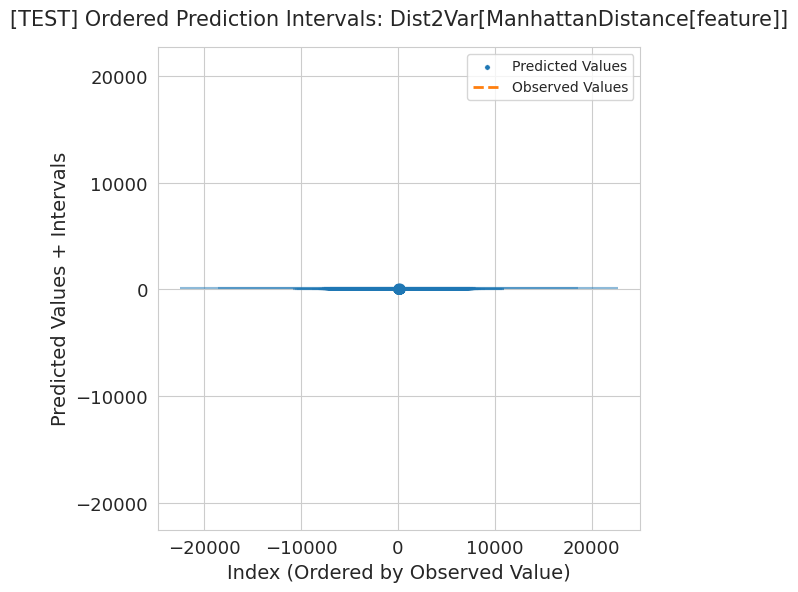
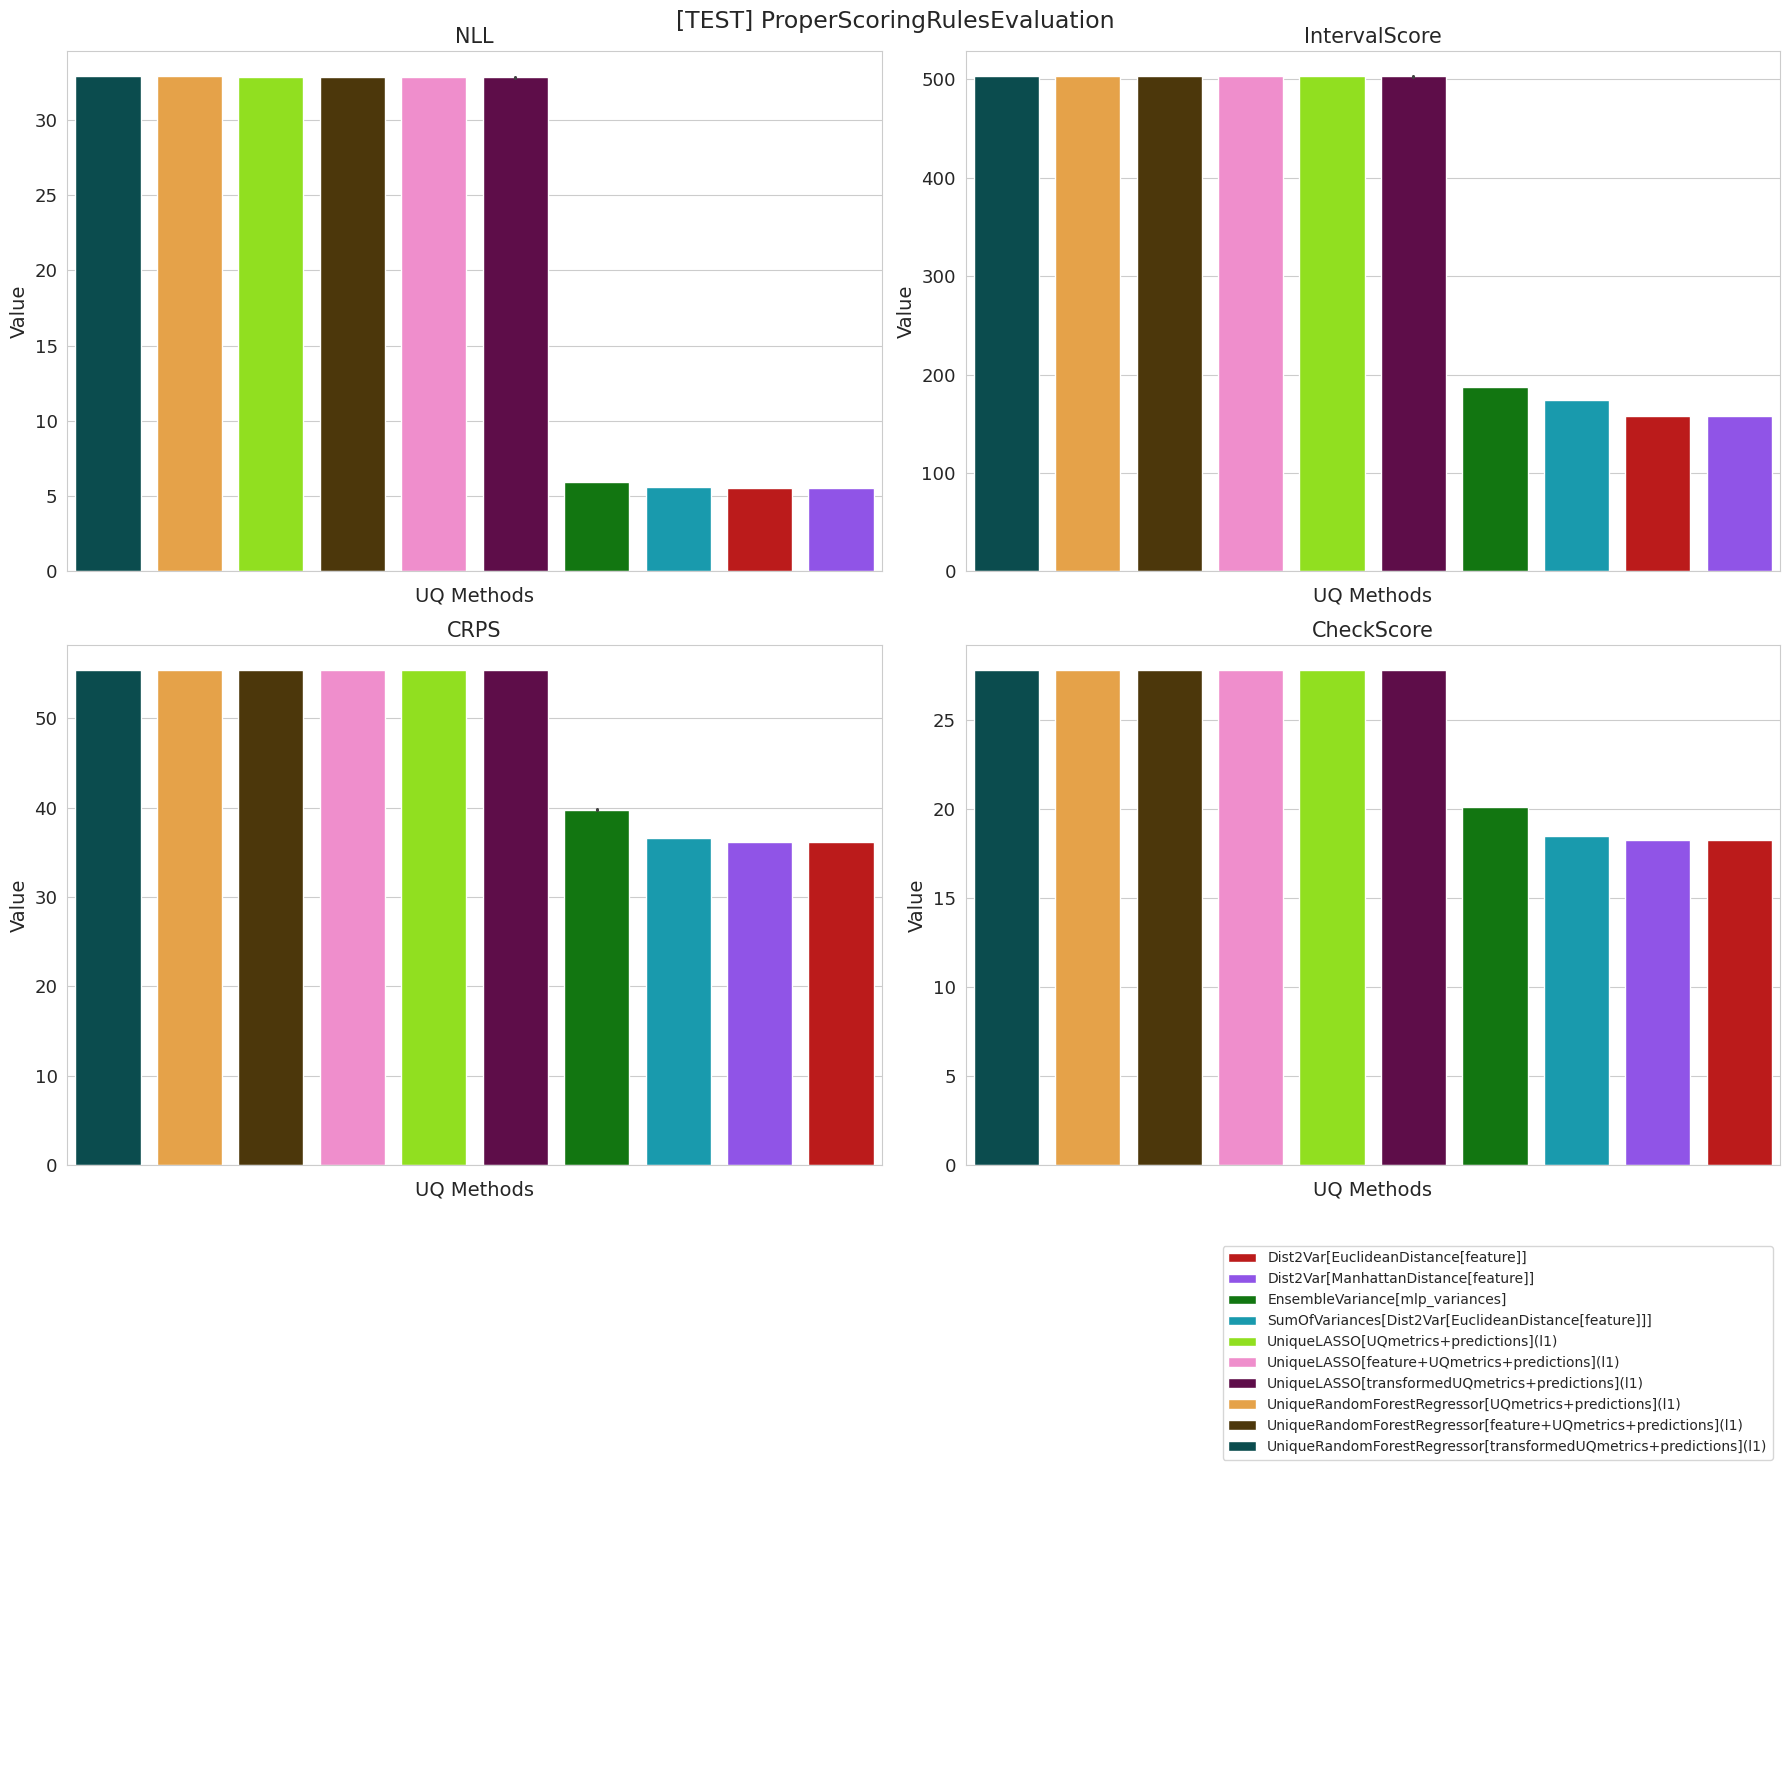
3. [TEST] ProperScoringRulesEvaluation: Dist2Var[ManhattanDistance[feature]]
[2024-10-04 18:30:56] | [UNIQUE - INFO]: ********************************* UNIQUE - END *********************************
[2024-10-04 18:30:56] | [UNIQUE - INFO]: Time elapsed: 00h:15m:56s
| UQ Method | Subset | AUC Difference: UQ vs. True Error | Spearman Correlation | Decreasing Coefficient | Performance Drop: High UQ vs. Low UQ (3-Bins) | Increasing Coefficient | Performance Drop: All vs. Low UQ (10-Bins) | Performance Drop: High UQ vs. Low UQ (10-Bins) | Performance Drop: All vs. Low UQ (3-Bins) | |
|---|---|---|---|---|---|---|---|---|---|---|
| 0 | ManhattanDistance[feature] | TEST | 4.342 | -0.147 | 2.616 | 1.011 | 2.706 | 0.986 | 1.044 | 0.997 |
| 1 | EuclideanDistance[feature] | TEST | 4.221 | -0.122 | 3.304 | 1.017 | 2.273 | 0.991 | 1.029 | 1.002 |
| 2 | EnsembleVariance[mlp_variances] | TEST | 7.595 | -0.593 | 0.272 | 0.859 | 4.468 | 0.832 | 0.809 | 0.925 |
| 3 | Diff5NN[ManhattanDistance[feature], EnsembleVariance[mlp_variances]] | TEST | 6.194 | -0.375 | 0.110 | 0.902 | 4.455 | 0.936 | 0.898 | 0.952 |
| 4 | Diff5NN[ManhattanDistance[feature], predictions] | TEST | 3.778 | 0.075 | 4.432 | 1.034 | 0.825 | 1.015 | 1.092 | 1.012 |
| 5 | Diff5NN[EuclideanDistance[feature], EnsembleVariance[mlp_variances]] | TEST | 6.149 | -0.369 | 0.102 | 0.904 | 4.432 | 0.940 | 0.899 | 0.953 |
| 6 | Diff5NN[EuclideanDistance[feature], predictions] | TEST | 3.776 | 0.080 | 4.460 | 1.038 | 0.674 | 1.014 | 1.092 | 1.015 |
| 7 | Dist2Var[ManhattanDistance[feature]] | TEST | 4.342 | -0.147 | 2.616 | 1.011 | 2.706 | 0.986 | 1.044 | 0.997 |
| 8 | Dist2Var[EuclideanDistance[feature]] | TEST | 4.221 | -0.122 | 3.304 | 1.017 | 2.273 | 0.991 | 1.029 | 1.002 |
| 9 | SumOfVariances[Dist2Var[EuclideanDistance[feature]]] | TEST | 7.557 | -0.597 | 0.272 | 0.857 | 4.468 | 0.851 | 0.828 | 0.924 |
| 10 | UniqueRandomForestRegressor[feature+UQmetrics+predictions](l1) | TEST | 0.023 | 0.992 | 4.468 | 1.268 | 0.000 | 1.195 | 1.539 | 1.126 |
| 11 | UniqueRandomForestRegressor[UQmetrics+predictions](l1) | TEST | 0.052 | 0.984 | 4.468 | 1.266 | 0.000 | 1.194 | 1.536 | 1.125 |
| 12 | UniqueRandomForestRegressor[transformedUQmetrics+predictions](l1) | TEST | 0.051 | 0.984 | 4.468 | 1.266 | 0.000 | 1.194 | 1.536 | 1.125 |
| 13 | UniqueLASSO[feature+UQmetrics+predictions](l1) | TEST | 0.031 | 0.990 | 4.468 | 1.268 | 0.000 | 1.195 | 1.538 | 1.126 |
| 14 | UniqueLASSO[UQmetrics+predictions](l1) | TEST | 0.061 | 0.981 | 4.468 | 1.266 | 0.000 | 1.193 | 1.534 | 1.125 |
| 15 | UniqueLASSO[transformedUQmetrics+predictions](l1) | TEST | 0.081 | 0.976 | 4.468 | 1.264 | 0.000 | 1.192 | 1.531 | 1.124 |
| UQ Method | Subset | MACE | RMSCE | |
|---|---|---|---|---|
| 0 | EnsembleVariance[mlp_variances] | TEST | 0.381 | 0.476 |
| 1 | Dist2Var[ManhattanDistance[feature]] | TEST | 0.314 | 0.388 |
| 2 | Dist2Var[EuclideanDistance[feature]] | TEST | 0.310 | 0.383 |
| 3 | SumOfVariances[Dist2Var[EuclideanDistance[feature]]] | TEST | 0.379 | 0.474 |
| 4 | UniqueRandomForestRegressor[feature+UQmetrics+predictions](l1) | TEST | 0.400 | 0.502 |
| 5 | UniqueRandomForestRegressor[UQmetrics+predictions](l1) | TEST | 0.400 | 0.502 |
| 6 | UniqueRandomForestRegressor[transformedUQmetrics+predictions](l1) | TEST | 0.400 | 0.502 |
| 7 | UniqueLASSO[feature+UQmetrics+predictions](l1) | TEST | 0.400 | 0.502 |
| 8 | UniqueLASSO[UQmetrics+predictions](l1) | TEST | 0.400 | 0.502 |
| 9 | UniqueLASSO[transformedUQmetrics+predictions](l1) | TEST | 0.400 | 0.502 |
| UQ Method | Subset | NLL | CheckScore | CRPS | IntervalScore | |
|---|---|---|---|---|---|---|
| 0 | EnsembleVariance[mlp_variances] | TEST | 5.965 | 20.093 | 39.794 | 187.592 |
| 1 | Dist2Var[ManhattanDistance[feature]] | TEST | 5.517 | 18.278 | 36.196 | 157.577 |
| 2 | Dist2Var[EuclideanDistance[feature]] | TEST | 5.517 | 18.278 | 36.197 | 157.589 |
| 3 | SumOfVariances[Dist2Var[EuclideanDistance[feature]]] | TEST | 5.604 | 18.497 | 36.633 | 173.948 |
| 4 | UniqueRandomForestRegressor[feature+UQmetrics+predictions](l1) | TEST | 32.847 | 27.800 | 55.416 | 503.113 |
| 5 | UniqueRandomForestRegressor[UQmetrics+predictions](l1) | TEST | 32.887 | 27.802 | 55.419 | 503.188 |
| 6 | UniqueRandomForestRegressor[transformedUQmetrics+predictions](l1) | TEST | 32.886 | 27.802 | 55.419 | 503.187 |
| 7 | UniqueLASSO[feature+UQmetrics+predictions](l1) | TEST | 32.846 | 27.800 | 55.416 | 503.101 |
| 8 | UniqueLASSO[UQmetrics+predictions](l1) | TEST | 32.844 | 27.800 | 55.415 | 503.067 |
| 9 | UniqueLASSO[transformedUQmetrics+predictions](l1) | TEST | 32.804 | 27.798 | 55.411 | 502.971 |

# Optionally save the computed UQ metrics
pd.DataFrame.from_dict(output).to_csv(pipeline.output_path / "uq_metrics_values.csv", index=False)

# `eval_results` is a dict containing the evaluation data used to generate the plots