shinyValidator
shinyValidator.Rmd
library(shinyValidator)Getting started
Project structure
{shinyValidator} requires the Shiny app to belong to a
package. We believe that packages are relevant for a Shiny app:
- Offers easy documentation.
- Unit-tests.
- Easier to maintain.
{shinyValidator} has been built with
golem in mind. Particularly, it expects to have these
functions:
-
app_server(). -
app_ui(). -
run_app().
Under the hood, {shinyValidator} brings its own version
of run_app(), namely run_app_audit() to inject
various elements necessary to the validation steps. It also
automatically creates a CI/CD file template so that the workflow is
ready to run on Github Actions or Gitlab CI/CD. Other elements such as a
custom .lintr file and package suggests are imported to
reduce the amount of work you have to do. Finally, a few JavaScript (JS)
assets are copied as they are necessary to run the Monkey tests,
thereby preventing proxy issues from blocking external JS assets in
corporate environments.
Typical setup workflow with {golem}
Initialize package
path <- file.path(tempdir(), "mypkg")
golem::create_golem(path)
usethis::use_mit_license() # or whatever license
usethis::use_testthat()
usethis::use_test("dummy")
usethis::use_git()
usethis::use_github() # make sure to have a valid GITHUB_PAT
# ...
Prepare {renv}
Before using renv, we suggest to create a
.Renviron file containing:
RENV_PATHS_LIBRARY_ROOT = ~/.renv/library
system("echo 'RENV_PATHS_LIBRARY_ROOT = ~/.renv/library' >> .Renviron")and restart R.
Overall, this options creates the renv library outside
the current Shiny app project folder, which avoids delays during
devtools::check() and devtools::build().
Setting up {renv}
Before initializing {shinyValidator},
renv must be activated in your project. It allows you to
properly maintain your dependencies and isolate each project. This way,
it prevents from accidentally breaking the code after installing a new
package version that could be incompatible with your current code base.
While this is more efforts, it is a game changer in the long run.
# DaVinci renv
library(renv)

# SCAN the project and look for dependencies
renv::init()

# install missing packages
renv::install(c("DT, lubridate, vdiffr"))
renv::install("<OTHER_PKG>")

# Capture new dependencies after package installation
renv::snapshot()
As a side note, renv may also be used during CI/CD (see an example here). To have faster package restoration with renv during CI/CD, you may replace the CRAN repository and point to binaries, below for Linux Focal (Ubuntu 20.04 LTS):
"R": {
  "Version": "4.1.0",
  "Repositories": [
    {
      "Name": "CRAN",
      "URL": "https://packagemanager.rstudio.com/all/__linux__/focal/latest"
    }
  ]
}
{shinyValidator} setup
If your are using Github, don’t forget to connect the remote
repository to the local one before initializing
{shinyValidator}.
Below shows how to activate {shinyValidator}:
devtools::install_github("Novartis/shinyValidator")
library(shinyValidator)
## At the root of your R package
use_validator("github")
devtools::document() # update help
renv::snapshot()
audit_app() is the main package function. It essentially
runs a series of tests based on the predefined parameters or scope:
audit_app(
  headless_actions = NULL,
  scope = c("manual", "DMC", "POC"),
  debug = FALSE,
  timeout = NULL,
  cran = FALSE,
  vignettes = FALSE,
  error_on = "never",
  workers = 5,
  crash_test = TRUE,
  output_validation = FALSE,
  coverage = TRUE,
  load_testing = TRUE,
  profile_code = TRUE,
  check_reactivity = TRUE,
  flow = FALSE,
  r_version = NULL,
  locked_deps = NULL,
  port = httpuv::randomPort(min = 3000, max = 3500)
  ...
)
Although primarily meant to be called from CI/CD, it may also run
locally, provided that you have shinycannonand a
Chrome-based browser. Fortunately, audit_app() is able to
detect any compatibility issue and accordingly warn you.
audit_app() gives you the flexibility to choose whatever
level of testing you want. The following code will only enable basic
check and linting:
audit_app(scope = "POC") # Proof of conceptAt the moment, 3 predefined scopes exist:
- manual: You have full control on the level of testing you want to apply. This is the default choice.
- DMC: setup validation tools for DMC apps (data monitoring committee, an independent group responsible to assess the efficacy and safety for patients in a clinical trial), where testing expectations are very high.
- POC: setup validation tools for proof of concept apps, where minor testing is required.
What you still have to do
Even though {shinyValidator} offers many helpers, there
is still some work to be done, particularly for output validation
(plots, htmlwidgets, …), and testing in general. Importantly,
{shinyValidator} will not automatically
write such tests for you, like unit tests.
As a reminder, to initialize tests in a package, you run:
usethis::use_testthat() # Init tests folder structure
usethis::use_test("modules") # creates test-module.R
Note about Shiny server testing
Shiny server function testing consists of simulating a mock session, thereby providing access to reactive values, inputs and outputs, like you would have in a real session. This is very convenient to check how Shiny modules interact together for instance. However, none of this can be automated, which means these tests will have to be written by someone. As an example, assume a Shiny app with this server function:
app_server <- function(input, output, session) {
  # Your application server logic
  output$distPlot <- renderPlot({
    hist(rnorm(input$obs))
  })
}
One can write:
testServer(app_server, {
  session$setInputs(obs = 0)
  # There should be an error
  expect_error(output$distPlot)
  session$setInputs(obs = 100)
  str(output$distPlot)
})
Notice how inputs are set. This is because the test is run without the UI part. Therefore, it is the developer’s responsibility to drive the UI.
Important note: if you had to test Shiny modules, server testing only
works with the moduleServer() API (new API). For instance,
let’s rewrite the previous server function as a module:
my_base_hist <- function(id, extra) {
  moduleServer(id, function(input, output, session) {
    # Your application server logic
    output$distPlot <- renderPlot({
      hist(rnorm(input$obs * extra))
    })
  })
}
The new test script would be:
testServer(my_base_hist, args = list(extra = 0), {
  session$setInputs(obs = 100)
  expect_error(output$distPlot)
})
We leave the reader refer to the official documentation for further use cases.
Validation overview
In the following, we’ll review each validation step.
Lint
We believe that a good R project has consistent R style. This is particularly relevant when many people contribute to the same code base. Assuming we all have slightly different preferences, how do we maintain consistency after each commit?
Tools like lintr, a static code reviewer for R, help
doing this with a pretty straightforward API. The first step of the
{shinyValidator} pipeline utilizes lintr to
quickly analyse the ./R folder (default):
shinyValidator::lint_code(paths = "R", tolerance = 0)If you had to check more than one folder, you can pass a vector instead:
The tolerance is the number or errors to allow, which defaults to 0. We recommend not changing it and play the game!
This function may be called locally and we strongly suggest doing so
since it may ease the debugging process (rather than on CI/CD). As shown
in the following figure, the lintr found an issue in the
app_server.R file , line 6 with an extra white space, which
has to be removed.
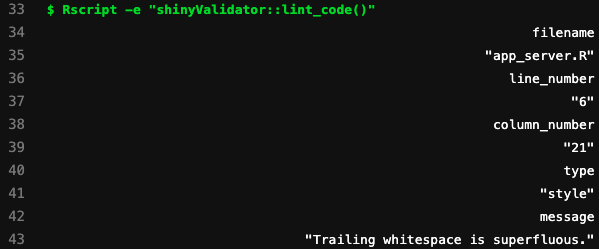
Example of linting output during CI/CD.
We strongly encourage to use lintr at the beginning of a project since the number of errors after 1 year of coding might be important and frustrating to debug.
If you think that lintr is too strict, you may fine
tune its behavior by
changing the .lintr file:
linters:
  with_defaults(
    line_length_linter = line_length_linter(100),
    infix_spaces_linter = NULL,
    object_usage_linter = NULL,
    object_name_linter = NULL,
    open_curly_linter = NULL,
    commented_code_linter = NULL,
    trailing_whitespace_linter = NULL
  )
Package check and build
While lintr analyses R code,
devtools::check() audits the overall package quality:
- Check that package can be built.
- Check for non standard files/folder.
- Check for correct DESCRIPTION file format.
- Check vignettes.
- Check documentation.
- Run unit tests.
- …
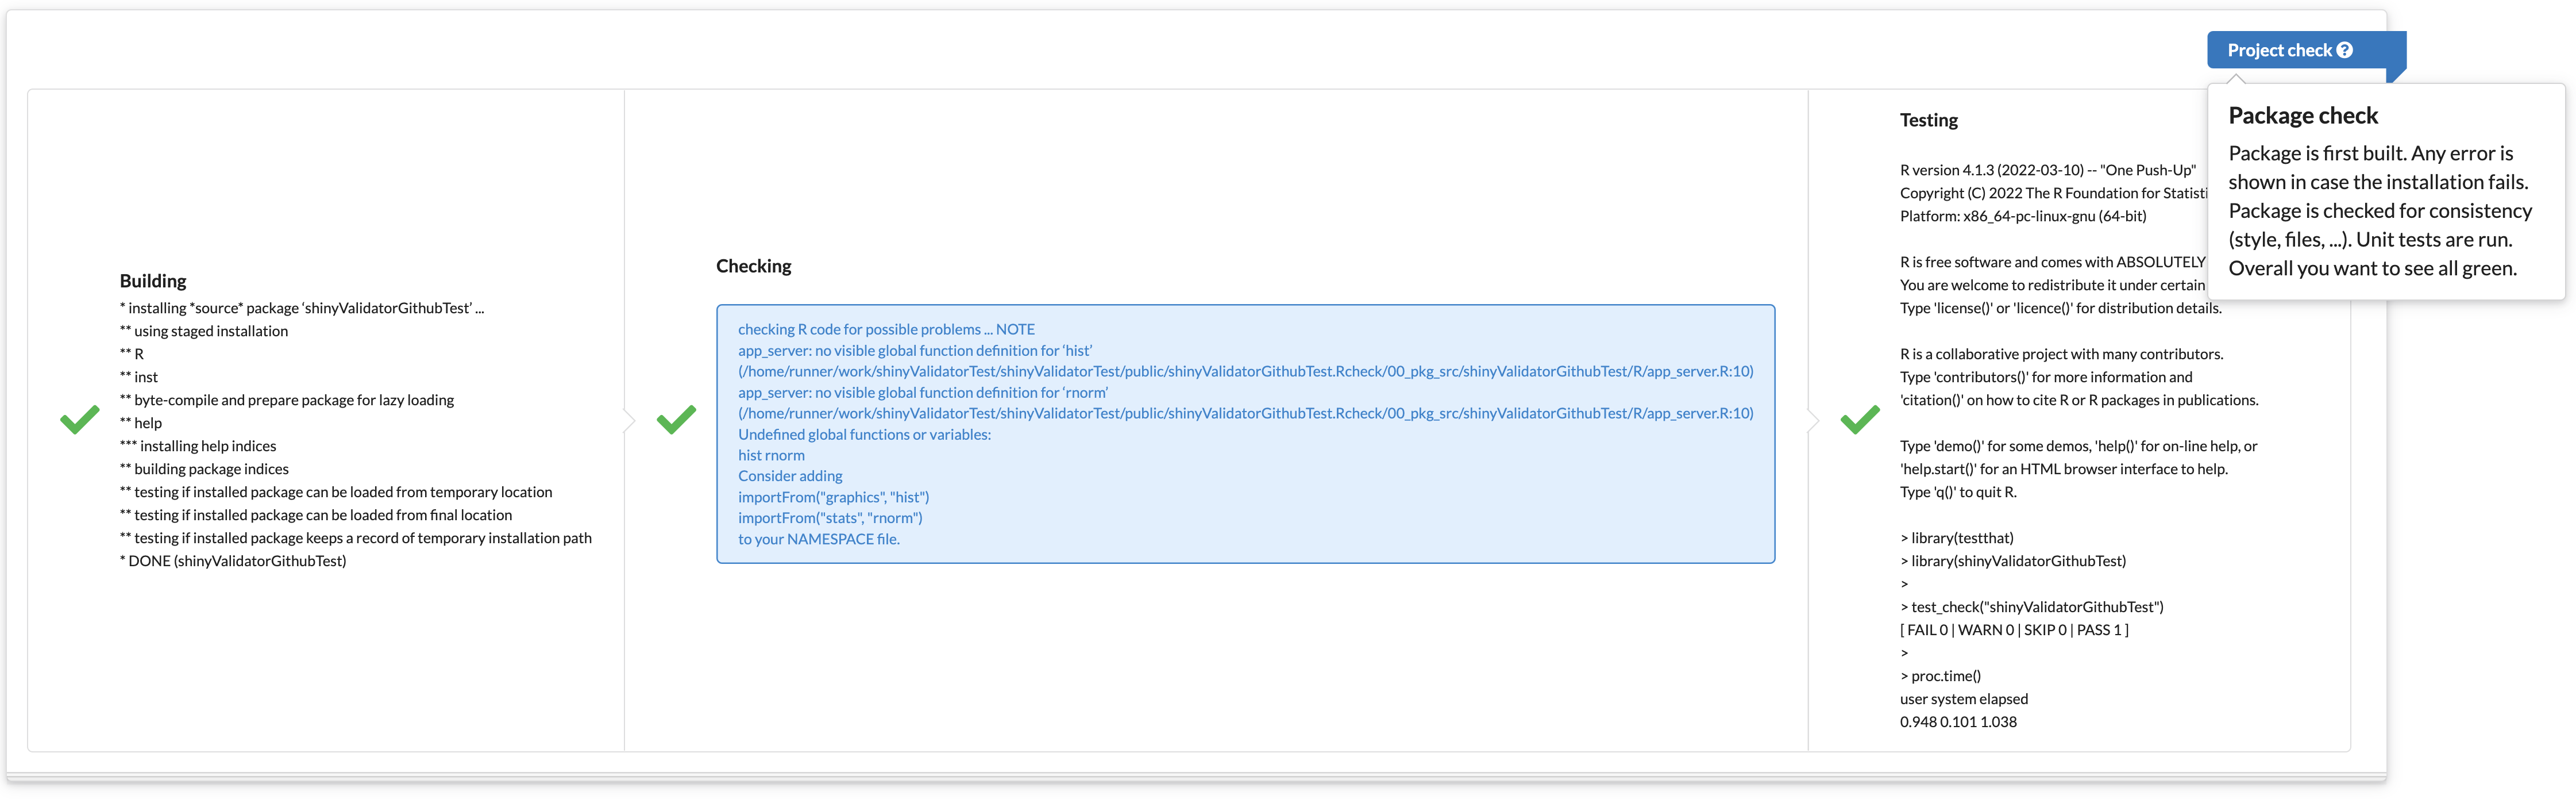
Package check report for {shinyValidator}.
Pretty much any error may be captured, which ultimately guarantees a high quality project, easy to maintain. Each potential issue is labelled as either NOTE, WARNING or in the worse case ERROR. In general, you don’t want to see ERROR nor WARNING. Few NOTES may be tolerated (in theory), although in practice, NOTES are most of the time rejected from CRAN submissions.
This step is crucial since it ensures global package quality. By
default, {shinyValidator} will not check vignettes nor
CRAN. This may however be customized depending on needs in the CI/CD
file. For instance, in the ./.gitlab-ci.yml, we can control
what parameter to pass to audit_app():
auditing:
  stage: audit
  script:
    - Rscript -e 'shinyValidator::audit_app(load_testing = FALSE, profile_code = FALSE, check_reactivity = FALSE, coverage = FALSE);'
  artifacts:
    paths:
      - public
    expire_in: 30 days
For GitHub Actions, you’ll have to modify the
.github/workflows/shiny-validator.yaml file:
- name: Audit app 🏥
  shell: Rscript {0}
  run: shinyValidator::audit_app() # Customize here ...
{shinyValidator} automatically generate a coverage
report (See {covr}), which gives a
rather good idea of the code testing state.
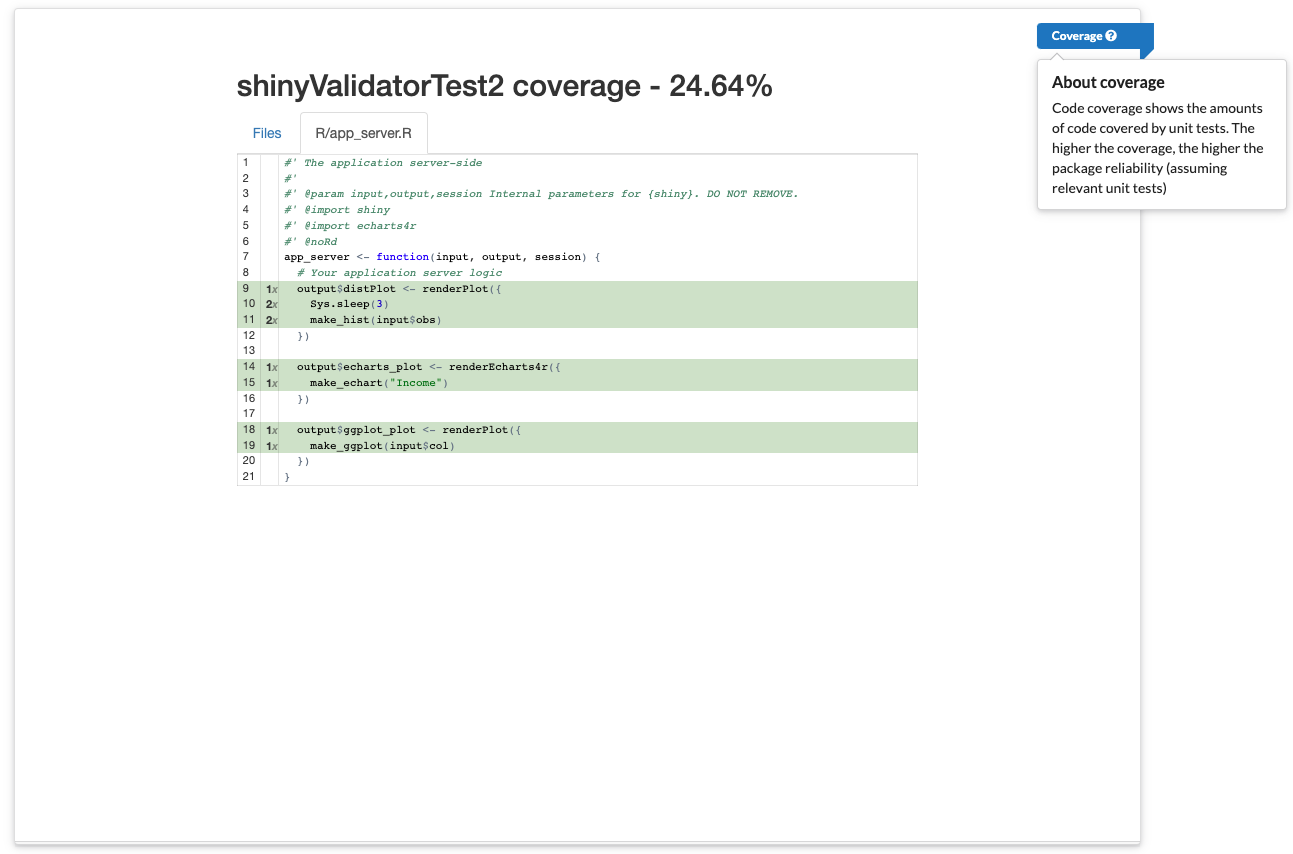
Coverage report available in {shinyValidator}
Crash test
If the two previous steps ensure global code quality, it does not check whether the application starts properly and remains alive after basic usage.
This is where the crash test comes to play. It first:
- Checks whether the app starts.
- Manipulates the app and checks if it remains alive after some time.
This step leverages R subprocesses, the idea being to start the app
on a child process, connect to the app with a headless
web-browser (without display). The run_crash-test()
function has two parameters:
-
headless_actions: required if you want to provide
custom instructions to manipulate the app with a headless browser. By
default,
{shinyValidator}performs a Monkey test (see also here), which consists of triggering random events on the app such as clicks, scroll, input change, … for 10 seconds. - timeout: if the app takes time to load, you have to adjust this value.
-
…: to pass any parameter to
run_app_audit().
shinyValidator::run_crash_test(headless_actions = NULL, timeout = 5)In the following screenshot, since the app is not particularly
complex (there is only one slider input), there is no need for a Monkey
test. Therefore, we start the app and change the slider input value to
200. This requires to pass a headless_actions
parameter. As {shinyValidator} relies on
shinytest2, we rely on the set_inputs method
to manipulate the slider:
# app refers to the headless app instance.
shinyValidator::run_crash_test({
  app$set_inputs(obs = 30)
  app$get_screenshot("plop.png")
  # ... pass any other commands from shinytest2 API
})
Then, we can modify the ./.gitlab-ci.yml file to account
for this new element:
auditing:
  stage: audit
  script:
    - Rscript -e 'shinyValidator::audit_app(headless_actions = custom_horde);'
  artifacts:
    paths:
      - public
    expire_in: 30 days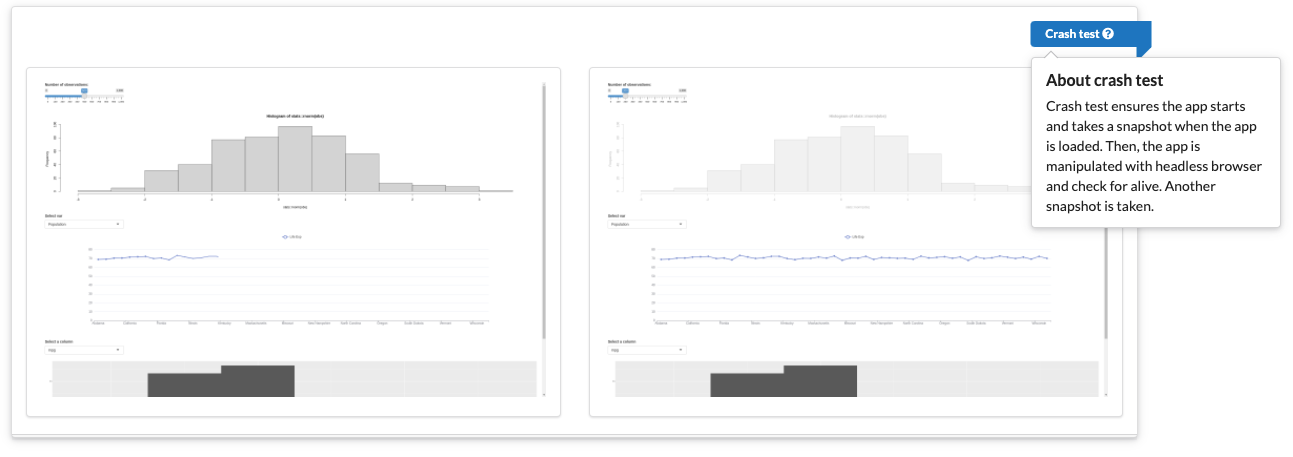
Crash test. Left: a snapshot is taken after initial app loading. Right: app undergo some usage, another snapshot is taken.
Output validation
During CI/CD, {shinyValidator} runs a global output
snapshot comparison to check whether the current commit shows similar
results as the current snapshot (as a reminder, you have to initialize a
first snapshot locally, which will server as reference for future
comparison). This however requires to have predefined tests, for
instance in test-basic-plot.R for a static base plot (work
similarly for ggplot2):
make_hist <- function(val) {
  hist(rnorm(val))
}
test_that("Base plot OK", {
  set.seed(42) # to avoid the test from failing due to randomness :)
  vdiffr::expect_doppelganger("Base graphics histogram", make_hist(500))
})
and test-echarts4r.R for an echarts4r
powered graph (htmlwidget):
test_that("echarts4r ok", {
  snapshot_widget <- function(path) {
    htmlwidgets::saveWidget(make_echart("Income"), path)
    path
  }

  expect_snapshot_file(snapshot_widget("tmp_echarts_plot.html"), "echarts_plot.html")
})
Don’t forget to account for random number generation if you are using
rnorm for instance. Whenever you modify the app, you have
to run devtools::test() locally to create snapshots of the
plots. If any difference is detected, the test will fail:
x |   0 1     | basic-plot [0.1 s]
─────────────────────────────────────────────────────────
Failure (test-basic-plot.R:3:3): Base plot OK
Snapshot of `testcase` to 'basic-plot/base-graphics-histogram.svg' has changed
Run `testthat::snapshot_review('basic-plot')` to review changes
Backtrace:
 1. vdiffr::expect_doppelganger("Base graphics histogram", make_hist(500)) test-basic-plot.R:3:2
 3. testthat::expect_snapshot_file(...)

[...]
══ Results ══════════════════════════════════════════════
Duration: 33.0 s

[ FAIL 3 | WARN 1 | SKIP 0 | PASS 1 ]

Keep trying!
{shinyValidator} displays a visual widgets (based on
diffviewer) for each detected snapshot difference,
allowing the developer to compare the current outputs to reference
snapshot. It is the developer’s responsibility to decide whether to
accept the changes. This may be done locally with:
testthat::snapshot_review('basic-plot')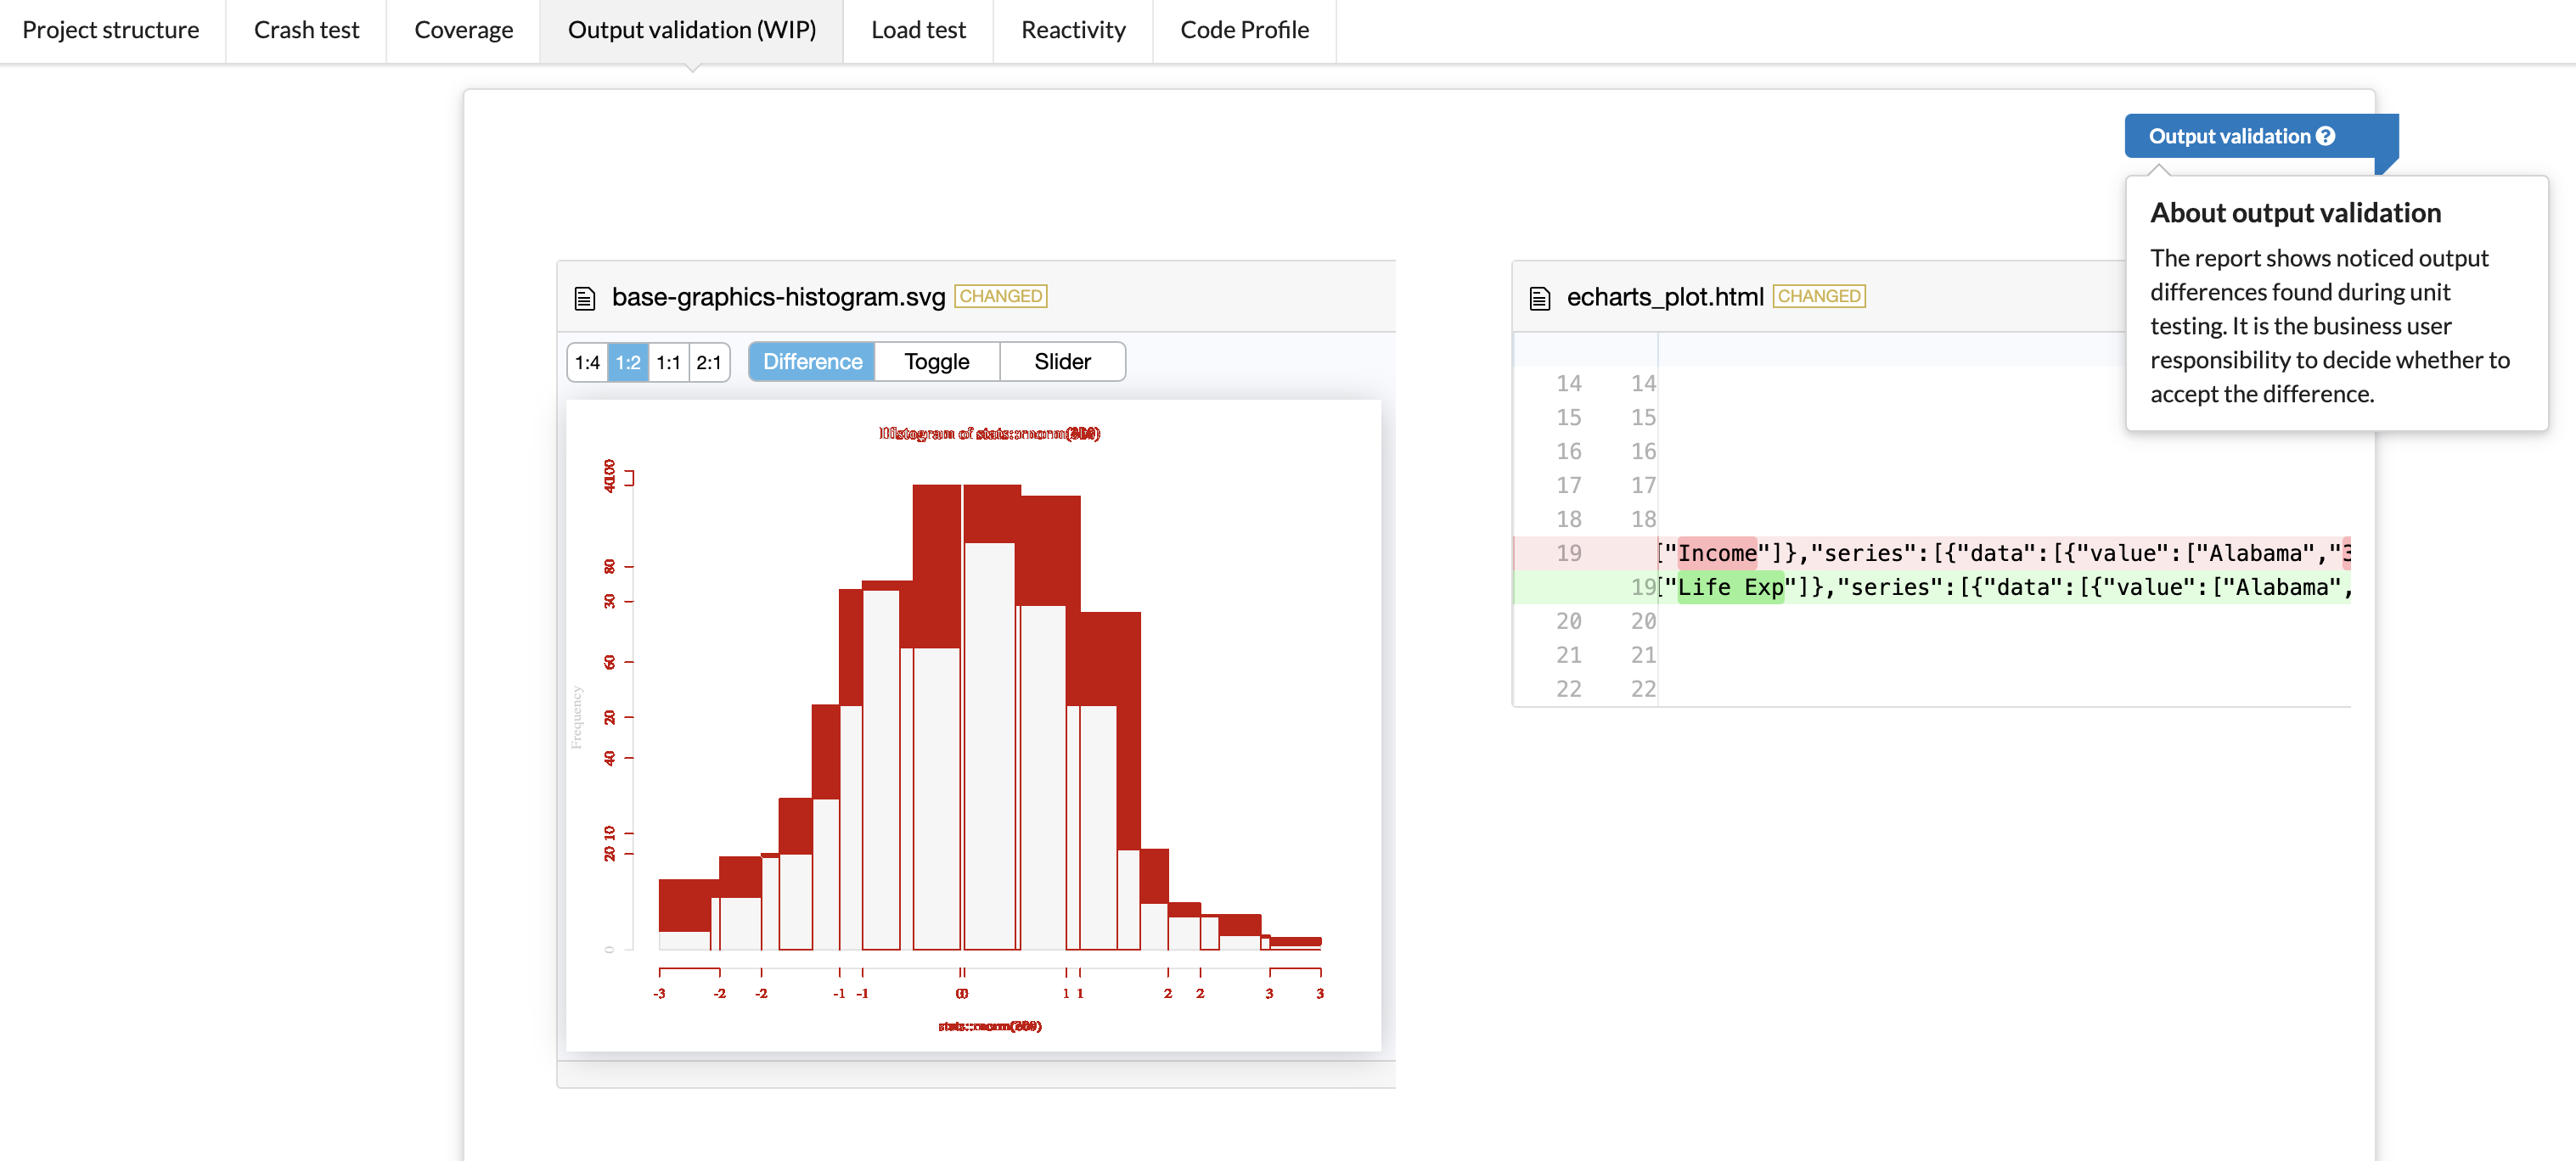
Output validation example. Left: static plot. Right: htmlwidget data.
Performance audit
The following tests are not as important as the app validation. Yet, if you want to offer optimized user experience, they are of great help.
Load test
A load test consists of checking whether a Shiny app handles multiple concurrent users without suffering from major performance issues. To the best of our knowledge, there is currently only one package allowing to audit Shiny apps load, that is {shinyloadtest}.
A load tests is composed of 3 steps:
- The end user (or the developer) records a realistic user session.
- This session is replayed in parallel to simulate simultaneous users.
- Results are analyzed.
From a technical point of view, there are 2 pieces of software:
- shinyloadtest provides the session recorder, stores logs and returns an HTML report.
- shinycannon is a cli tool that replays sessions in parallel.
In theory, the recording step is manual. However, it is entirely
possible to automate it with a headless web-browser. The idea being to
provide a realistic set of instructions to manipulate the app. This is
usually the trickiest part, but tools like the {shinytest}2
recorder can generate the replay script.
{shinyValidator} offers both approaches with the
record_app() function:
shinyValidator::record_app(headless_actions = NULL, timeout = 5, workers = 5, ...);workers corresponds to the number of parallel
sessions replayed by shinycannon in the background.
timeout is the time taken the the app to be ready and
headless_actions is a parameter to provide custom
manipulations with the shinytest2 API.
In the following screenshot, we still play with the same demo app
having only one slider input. The app is started locally on a R
subprocess, then we connect the shinyloadtest recorder.
We manipulate the app with the headless browser. The recorder is stopped
as well as the headless browser and shinycannon replays the
app (this is the longest part, depending on the number of workers).
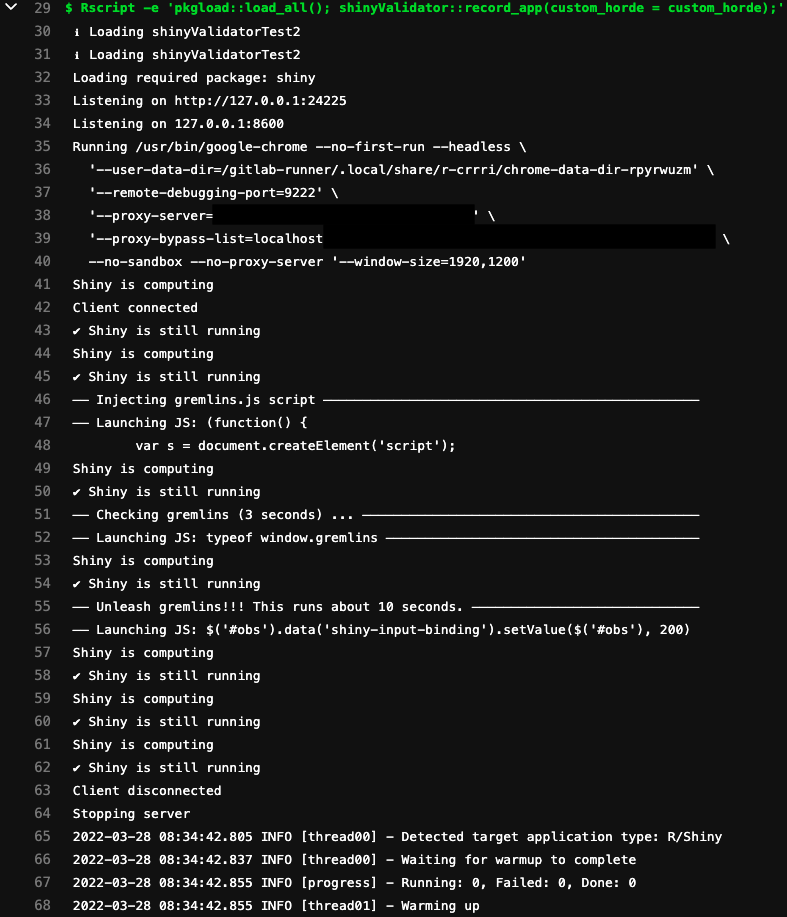
Load test during CICD
At the end, an HTML report with relevant results is generated. Overall, the blue area represent calculations. Ultimately, you want to see as less blue area as possible, compared to the grey area (time the app is resting). We leave the reader fallback to the official shinyloadtest documentation to get a thorough overview of load testing interpretation.
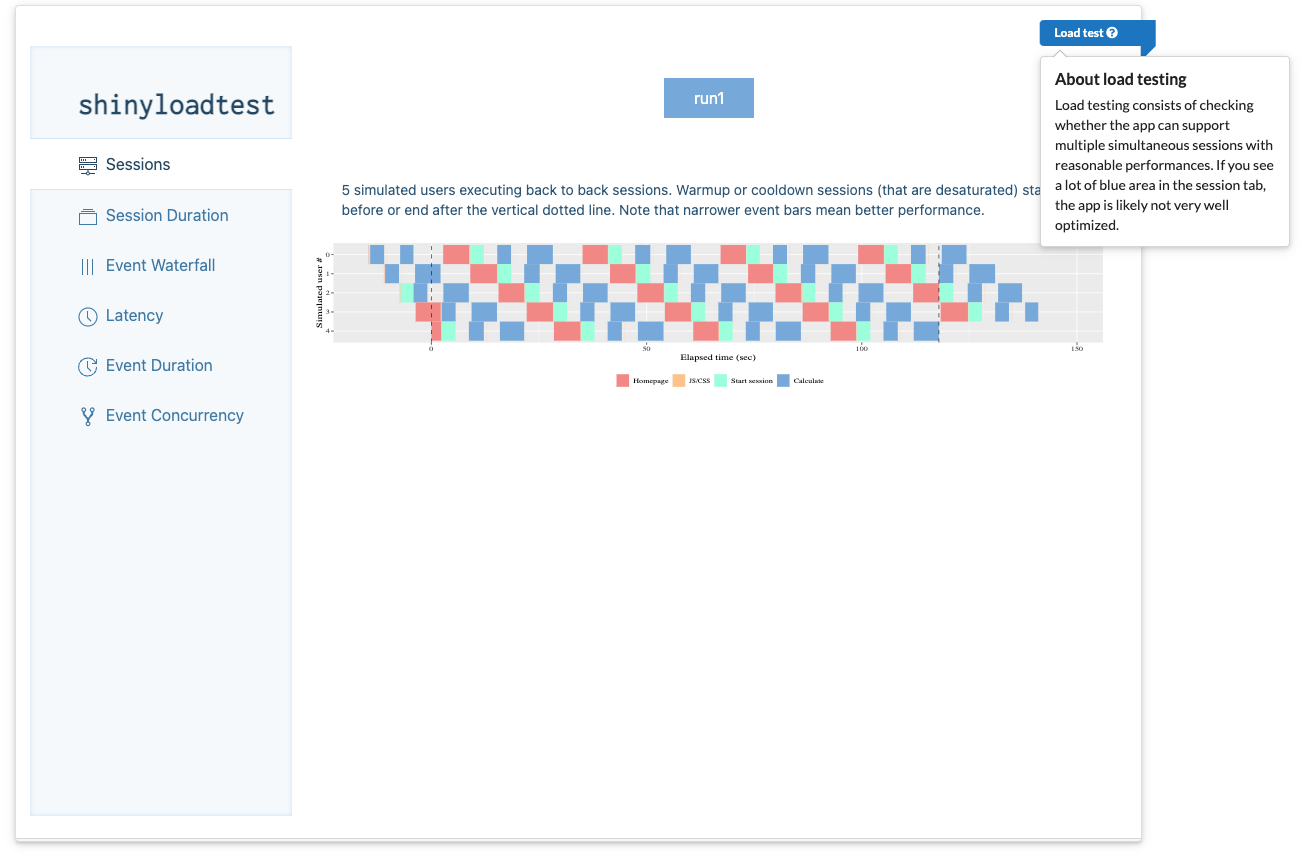
Load test HTML report
As a side note, if you ever see this error during the load-test:
load-test - HTTP Latency [====>----------------------------------------------------------] 2/26 eta:
0sError in svglite_(filename, bg, width, height, pointsize, standalone,  :
  Graphics API version mismatch
This is a known issue. Reinstall svglite from source:
install.packages("svglite", type = "source")Reactivity analysis
shiny is built on top the reactive programming concept. While it has many advantages (like caching), it is fairly straightforward to get lost in the reactive inferno, leading to very unstable apps.
Have you already experienced situations where a reactive expression did not update, an output did not react to the related input change or a reactive expression changed when a supposedly non-related input was changed? Don’t lie. I am sure you did …
{reaclog} is the tool you were looking for. It offers a
network representation of the app reactivity, allowing to quickly
identify potential issues. The reader will refer to the comprehensive
guide here.
In the background, {shinyValidator} automatically starts
the app in the background, wait for Shiny to be available, stops the app
and returns the reactlog object. The reactlog is in turn exported as a
standalone HTML widget to be included in the validation report, as shown
below. You may fine tune the timeout parameter to
account for the app loading duration and also add custom manipulation
through headless_actions:
shinyValidator::upload_reactlog(headless_actions = NULL, timeout = 5, ...);In the below output, we notice an isolated output. This is generally an issue, meaning that something was hard coded in the code. Here, we deliberately removed the input feeding into the echarts plot causing this strange pattern.
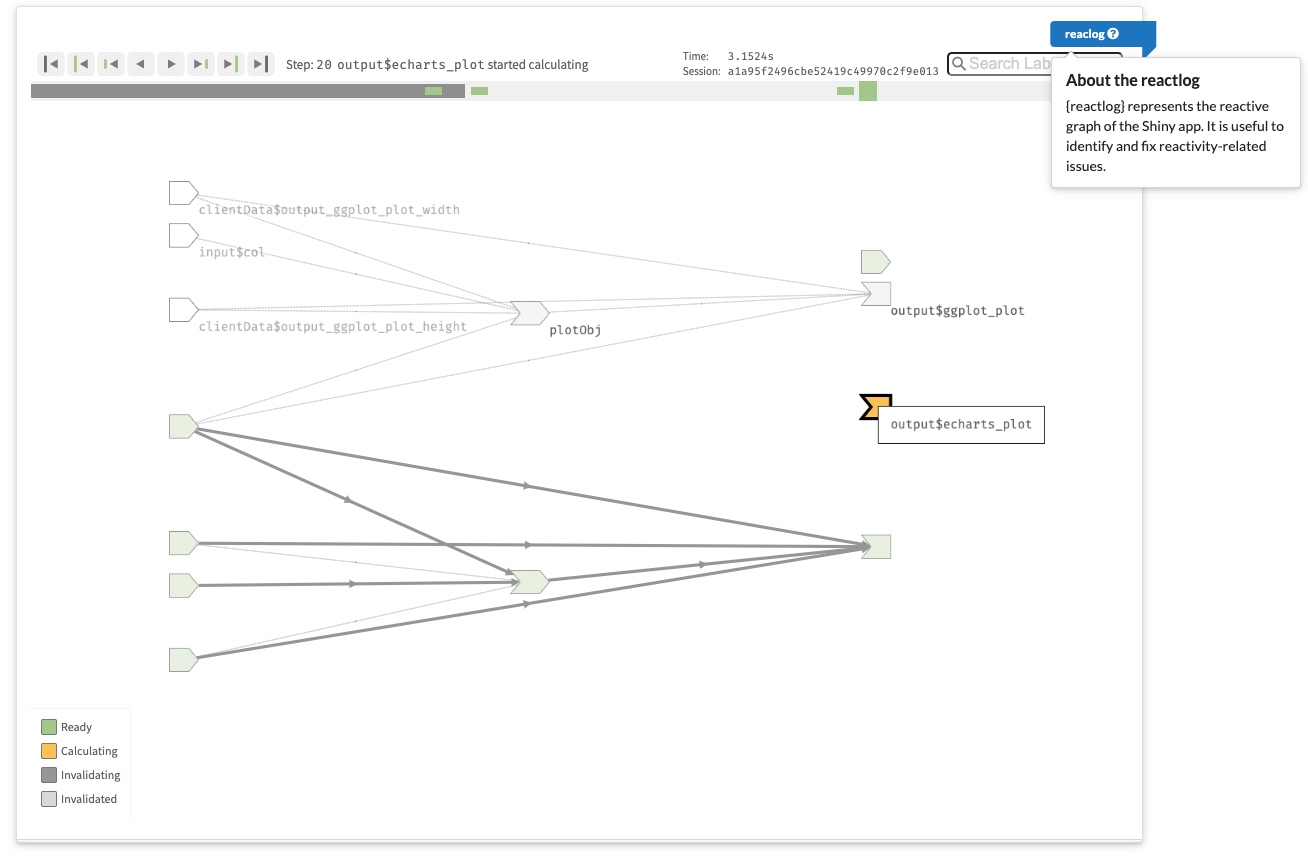
Shiny app reactivity graph. We see one output is not linked to any input. This is likely an issue.
Code profiling
Finally, in addition to the load test, it is good to have an idea of how much time your R code takes to run in the Shiny app, especially if you planned to provide some optimization. For instance, this might help to understand why there are many blue areas in the load test report.
{shinyValidator} leverages the profvis R
package to audit the Shiny app starting time. The app is also started in
the background, a headless connection is then established and closed,
which subsequently terminate the profvis recorder. Like
for the previous tests, it is possible to fine tune the app actions by
passing them within headless_actions.
We leave the reader to review the profvis documentation to get a better understanding of the report. Overall, as shown in the following figure, the left panel displays the time and memory taken by each code block. On the right side is a flame graph to explore the call stack in depth. Display options may be changed in the top right corner.
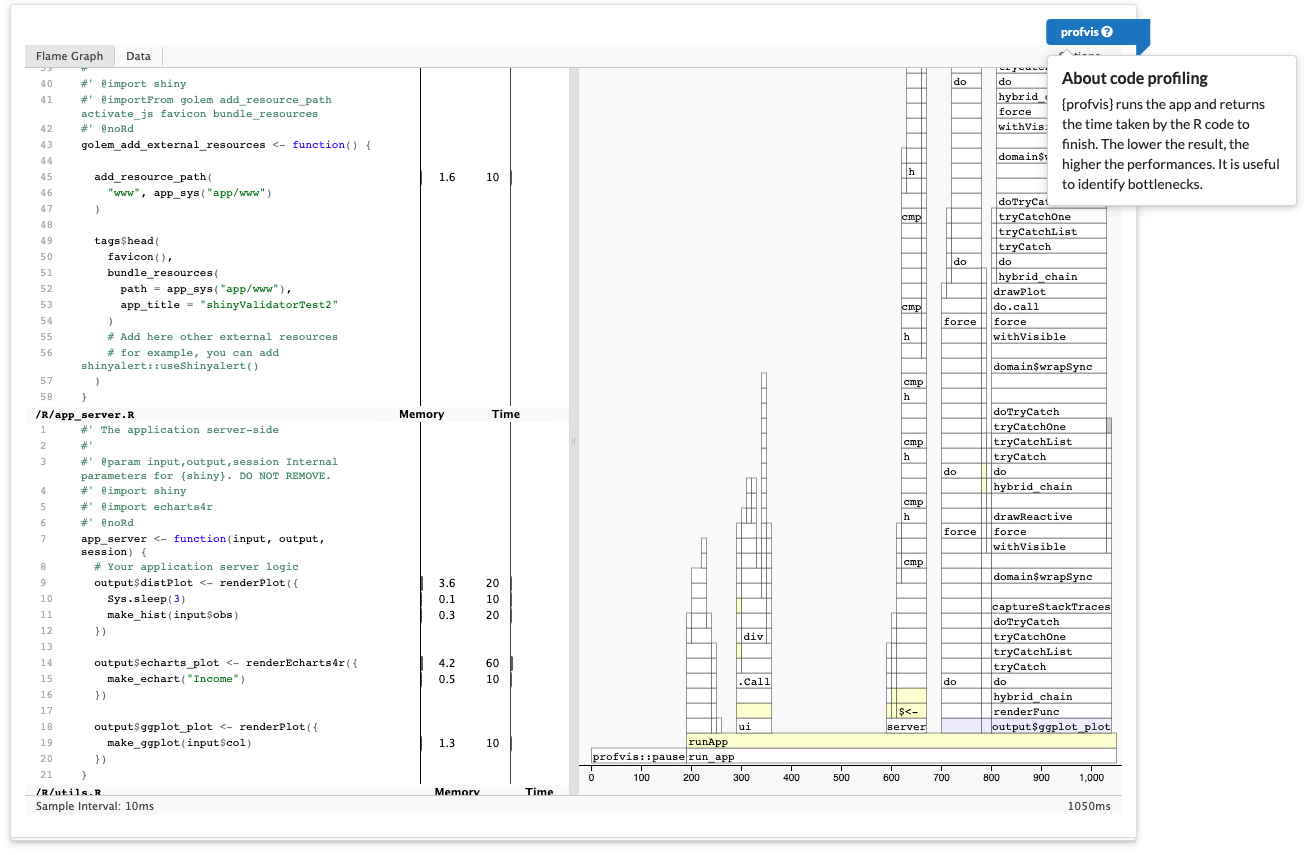
Shiny app profiling at start.