Reverselog transform for the y scale.
Source:R/xgx_scale_y_reverselog10.R
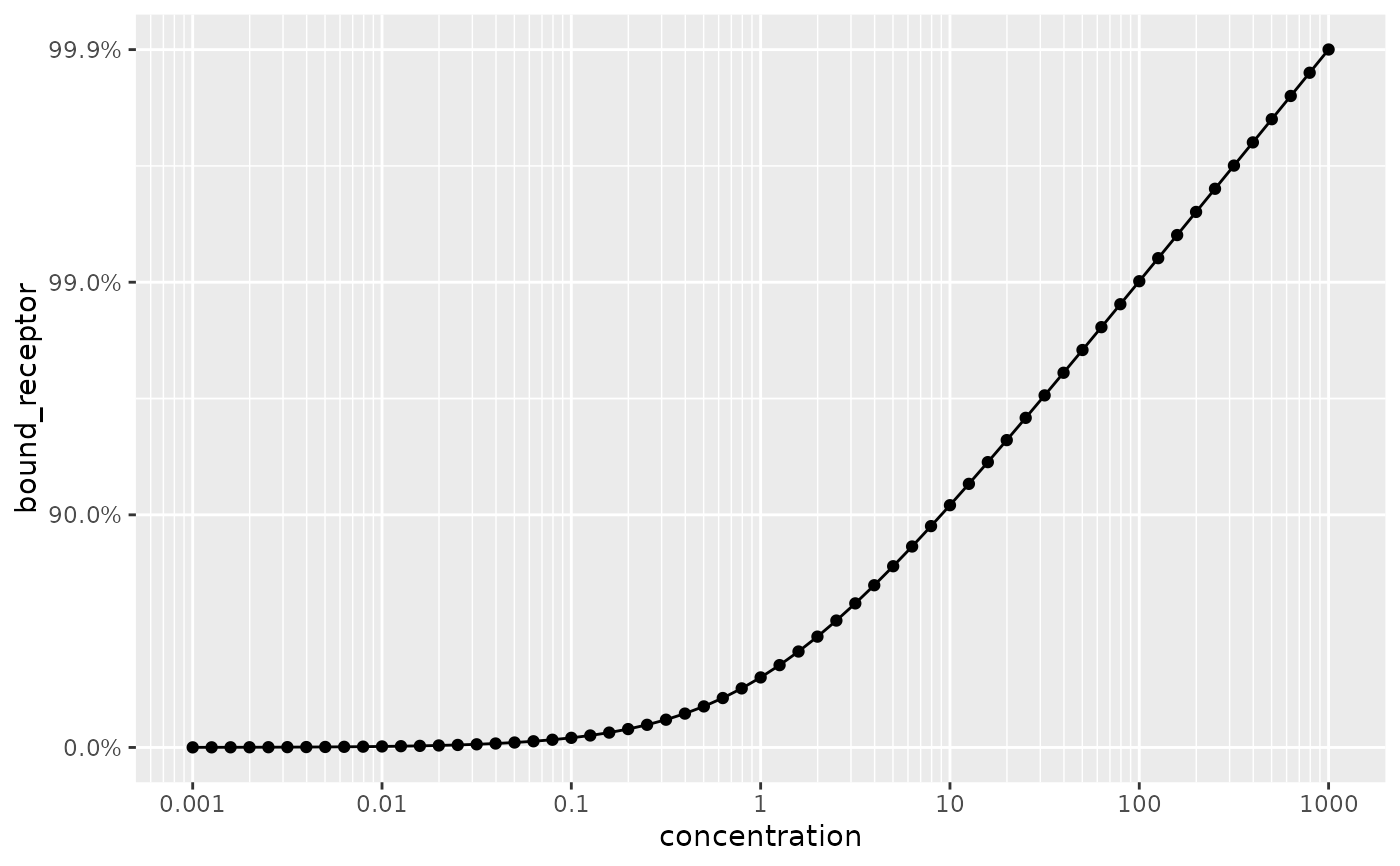
xgx_scale_y_reverselog10.Rdxgx_scale_y_reverselog10 is designed to be used with data
that approaches 100
A common example is receptor occupancy in drug development.
It is used when you want even spacing between 90, 99, 99.9, etc.
xgx_scale_y_reverselog10(labels = NULL, accuracy = NULL, ...)Arguments
Value
ggplot2 compatible scale object
Examples
conc <- 10^(seq(-3, 3, by = 0.1))
ec50 <- 1
data <- data.frame(concentration  = conc,
                   bound_receptor = 1 * conc / (conc + ec50))
ggplot2::ggplot(data, ggplot2::aes(x = concentration, y = bound_receptor)) +
ggplot2::geom_point() +
  ggplot2::geom_line() +
  xgx_scale_x_log10() +
  xgx_scale_y_reverselog10()