percentchangelog10 transform for the y scale.
Source:R/xgx_scale_y_percentchangelog10.R
xgx_scale_y_percentchangelog10.Rdxgx_scale_y_percentchangelog10 and xgx_scale_x_percentchangelog10 are designed
to be used with percent change (PCHG) from baseline data (on a scale of -1 to +Inf).
Common examples include
It is used when you have a wide range of data on a percent change scale,
especially data close to -100
xgx_scale_y_percentchangelog10(
  breaks = NULL,
  minor_breaks = NULL,
  labels = NULL,
  accuracy = 1,
  n_breaks = 7,
  ...
)

xgx_scale_x_percentchangelog10(
  breaks = NULL,
  minor_breaks = NULL,
  labels = NULL,
  accuracy = 1,
  n_breaks = 7,
  ...
)
Arguments
- breaks
if NULL, then default is to use a variant of 2^(labeling::extended(log2(PCHG + 1))) - 1, where PCHG represents the range of the data
- minor_breaks
if NULL, then default is to use nicely spaced log10(PCHG + 1) minor breaks
- labels
if NULL, then the default is to use scales::percent_format()
- accuracy
accuracy to use with scales::percent_format(), if NULL, then the default is set to 1
- n_breaks
number of desired breaks, if NULL, then the default is set to 7
- ...
other parameters passed to
scale_y_continuous
Value
ggplot2 compatible scale object
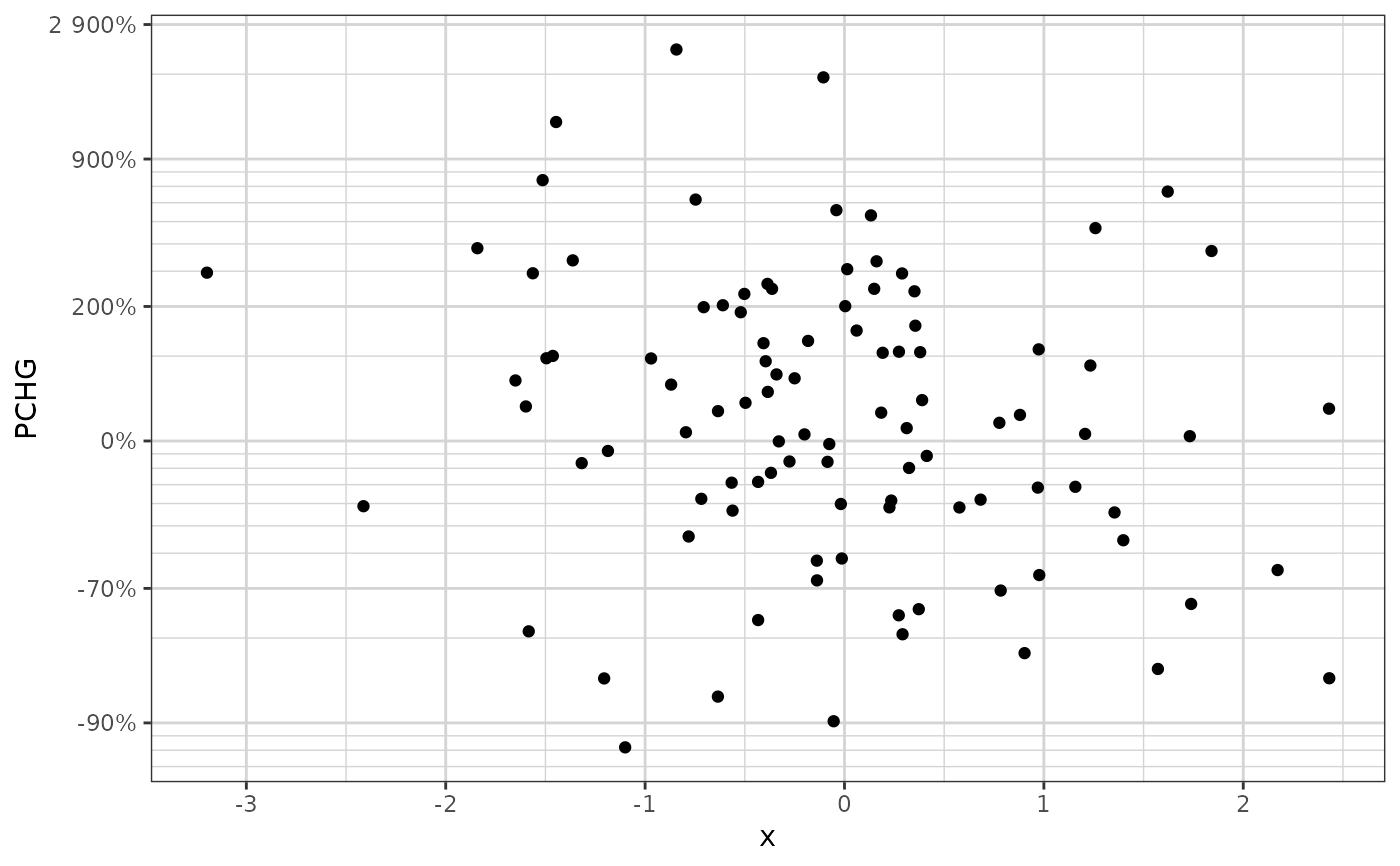
Examples
dat1 <- data.frame(x = rnorm(100), PCHG = exp(rnorm(100)) - 1)

ggplot2::ggplot(dat1, ggplot2::aes(x = x, y = PCHG)) +
  ggplot2::geom_point() +
  xgx_theme() +
  xgx_scale_y_percentchangelog10()