log10 scales the y axis with a "pretty" set of breaks
Source:R/xgx_scale_y_log10.R
xgx_scale_y_log10.Rdxgx_scale_y_log10 is similar to
scale_y_log10.
But it uses what we believe to be a nicer spacing and set of tick marks
it can be used the same as
scale_y_log10
xgx_scale_y_log10(
  breaks = xgx_breaks_log10,
  minor_breaks = NULL,
  labels = xgx_labels_log10,
  ...
)
Arguments
Value
ggplot2 compatible scale object
Examples
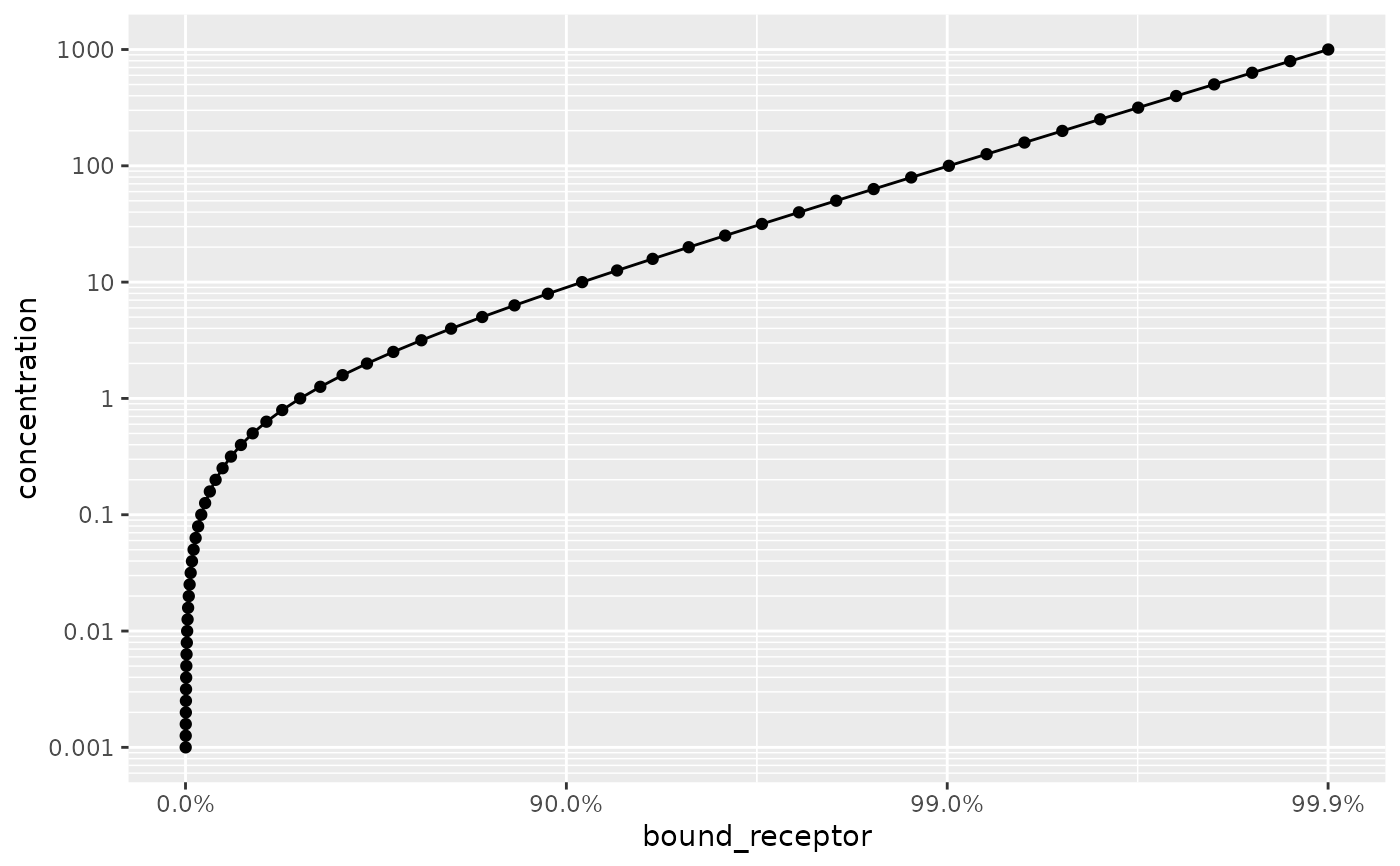
conc <- 10^(seq(-3, 3, by = 0.1))
ec50 <- 1
data <- data.frame(concentration = conc,
                   bound_receptor = 1 * conc / (conc + ec50))
ggplot2::ggplot(data, ggplot2::aes(y = concentration, x = bound_receptor)) +
  ggplot2::geom_point() +
  ggplot2::geom_line() +
  xgx_scale_y_log10() +
  xgx_scale_x_reverselog10()