Create a status (e.g. DRAFT) annotation layer
Source:R/xgx_annotate_status.R
xgx_annotate_status.Rdxgx_annotate_status adds a status (e.g. DRAFT) annotation layer
to a plot.
The text of the annotation can be customized, the default is "DRAFT".
The color, location, size, fontface, transparency of the annotation can
also be customized.
xgx_annotate_status(
  status = "DRAFT",
  x = Inf,
  y = Inf,
  color = "grey",
  hjust = 1.2,
  vjust = 1.2,
  fontsize = 7,
  fontface = "bold",
  alpha = 0.5,
  ...
)
Arguments
- status
the text to
- x
x location, default Inf (right most point)
- y
y location, default Inf (up most point)
- color
font color, default "grey"
- hjust
horizontal justification, default 1.2
- vjust
vertical justification, default 1.2
- fontsize
font size to use, default 7
- fontface
font style to use, default "bold"
- alpha
transparency, default is 0.5
- ...
other arguments passed on to
layer
Value
ggplot layer
Details
The default value of x = Inf works in many instances, but not some special data types like Dates. In that case, you will need to specify x
Examples
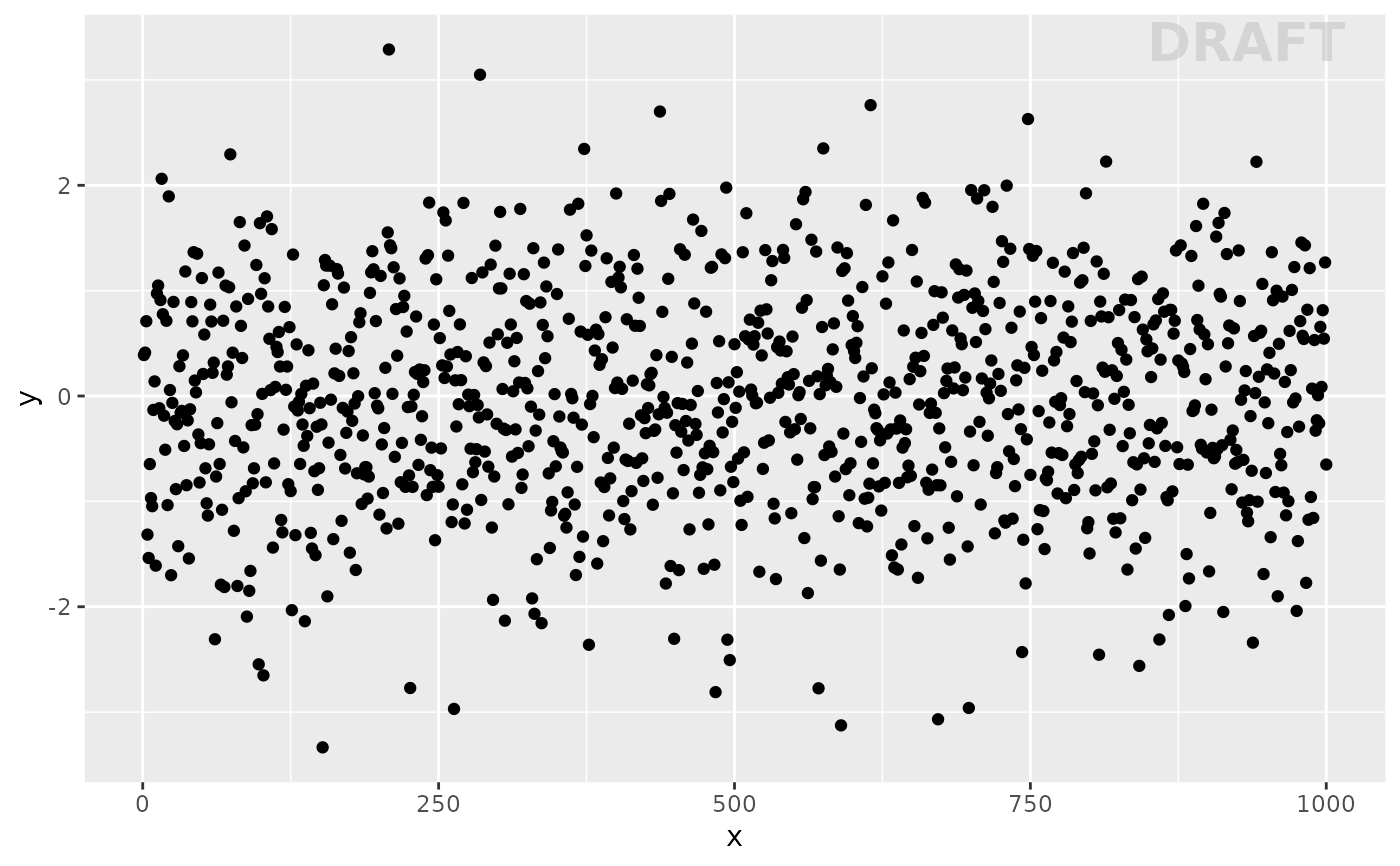
data <- data.frame(x = 1:1000, y = rnorm(1000))
ggplot2::ggplot(data = data, ggplot2::aes(x = x, y = y)) +
ggplot2::geom_point() +
xgx_annotate_status("DRAFT")
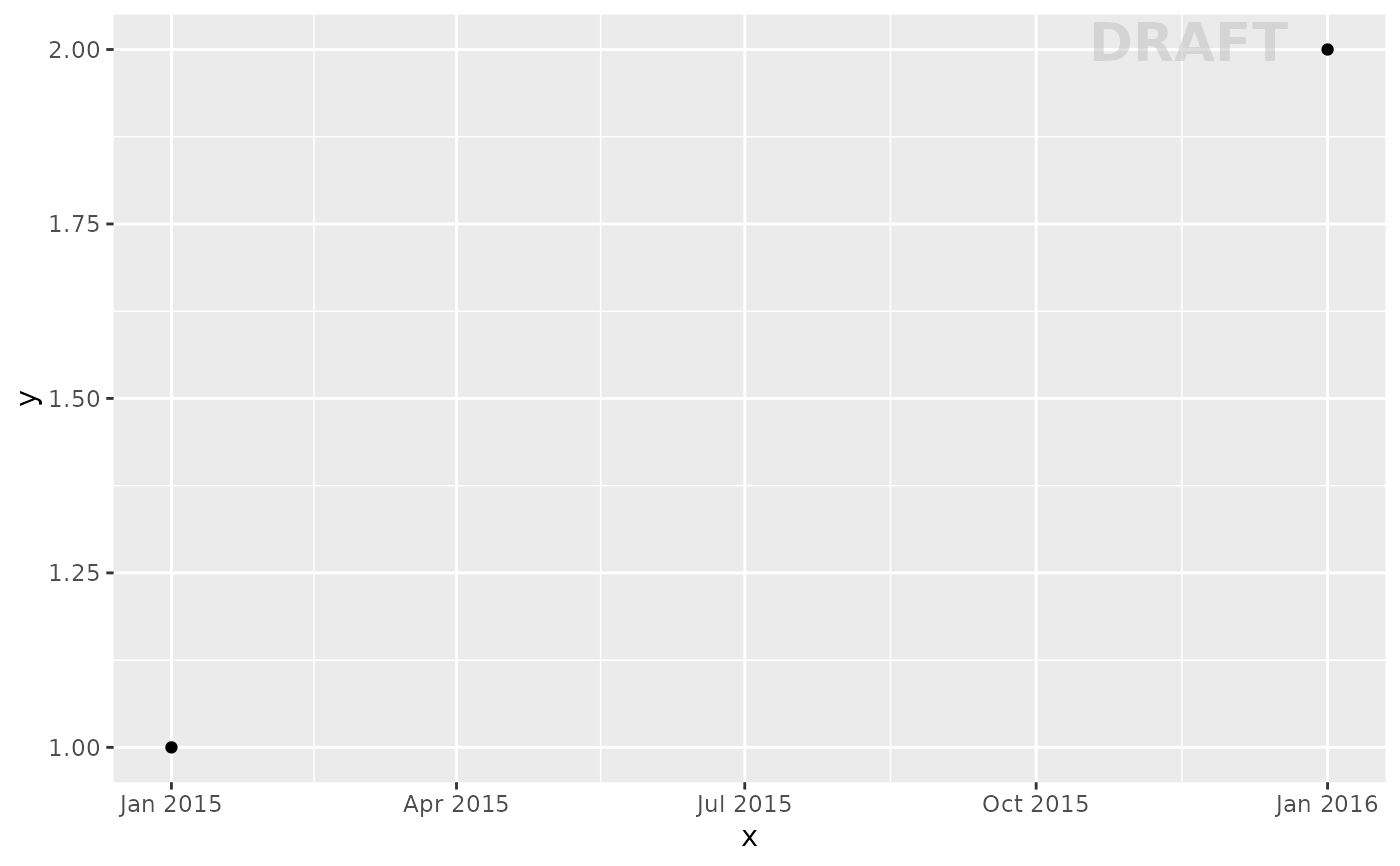
 # for dates in x-axis
data <- data.frame(x = as.Date(c("2015-01-01", "2016-01-01")), y = c(1,2))
xmax <- max(na.omit(data$x))
ggplot2::ggplot(data, ggplot2::aes(x = x, y = y)) +
ggplot2::geom_point() +
xgx_annotate_status("DRAFT", x = xmax)
# for dates in x-axis
data <- data.frame(x = as.Date(c("2015-01-01", "2016-01-01")), y = c(1,2))
xmax <- max(na.omit(data$x))
ggplot2::ggplot(data, ggplot2::aes(x = x, y = y)) +
ggplot2::geom_point() +
xgx_annotate_status("DRAFT", x = xmax)