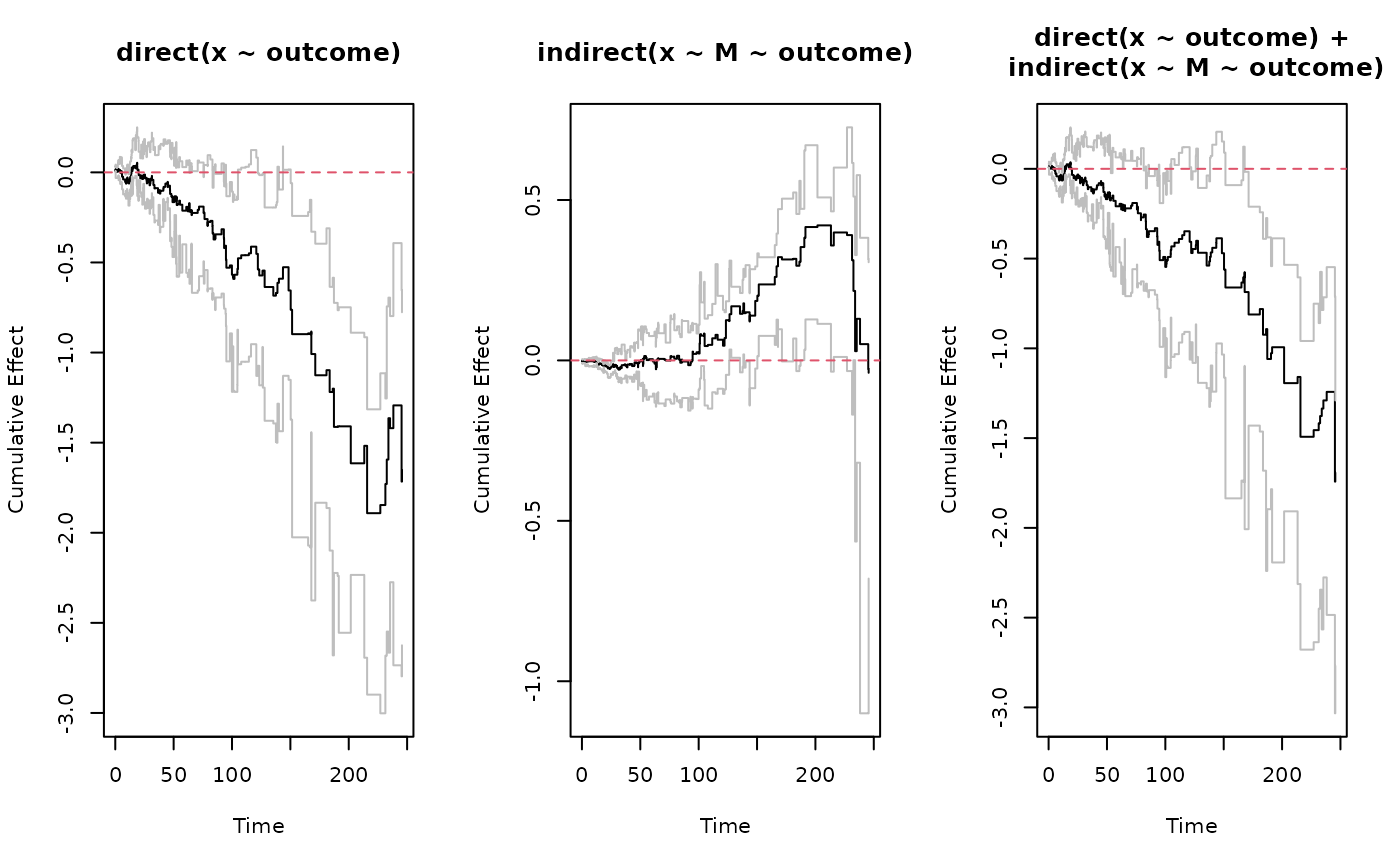
Plot effects from dynamic path analysis along with bootstrap confidence bands
plot.effect.Rdplotting method for class "effect"
Usage
# S3 method for class 'effect'
plot(x, relative = FALSE, ...)Value
this function does not return anything, but simply plots the associated effect encoded in the object x
Examples
library(dpasurv)

data(simdata)

set.seed(1)

# Perform dynamic path analysis:
# We set boot.n=30 for the example to run fast, should be set large enough
# so that results don't change meaningfully for different seeds.
s <- dpa(Surv(start,stop,event)~M+x, list(M~x), id="subject", data=simdata, boot.n=30)

direct <- effect(x ~ outcome, s)
indirect <- effect(x ~ M ~ outcome, s)
total <- sum(direct, indirect)

par(mfrow=c(1,3))
layout1x3 <- par(mfrow=c(1,3))
plot(direct); abline(h=0, lty=2, col=2)
plot(indirect); abline(h=0, lty=2, col=2)
plot(total); abline(h=0, lty=2, col=2)


# restore user's graphical parameters:
par(layout1x3)
# restore user's graphical parameters:
par(layout1x3)