Plot effects from dynamic path analysis along with bootstrap confidence bands
ggplot.effect.Rdplotting method for class "effect"
Arguments
- object
object of class "effect", or list of objects of class "effect"
- relative
should the effect be plotted on a relative survival scale (i.e. `y=exp(-effect)`)?. Defaults to FALSE.
- titles
If NULL, function will automatically generate. Otherwise character vector of length equal to number of elements in object list
- x_label
Label for x-axis. Defaults to "Time"
- y_label
Label for y-axis. Default when object scale is "cumulative" will be "Cumulative Effect" (relative=FALSE) and "Relative survival" (relative=TRUE). If object scale is "identity" then the default y_label will be "Effect".
Examples
library(dpasurv)
data(simdata)
set.seed(1)
# Perform dynamic path analysis:
# We set boot.n=30 for the example to run fast, should be set large enough
# so that results don't change meaningfully for different seeds.
s <- dpa(Surv(start,stop,event)~M+x, list(M~x), id="subject", data=simdata, boot.n=30)
direct <- effect(x ~ outcome, s)
indirect <- effect(x ~ M ~ outcome, s)
total <- sum(direct, indirect)
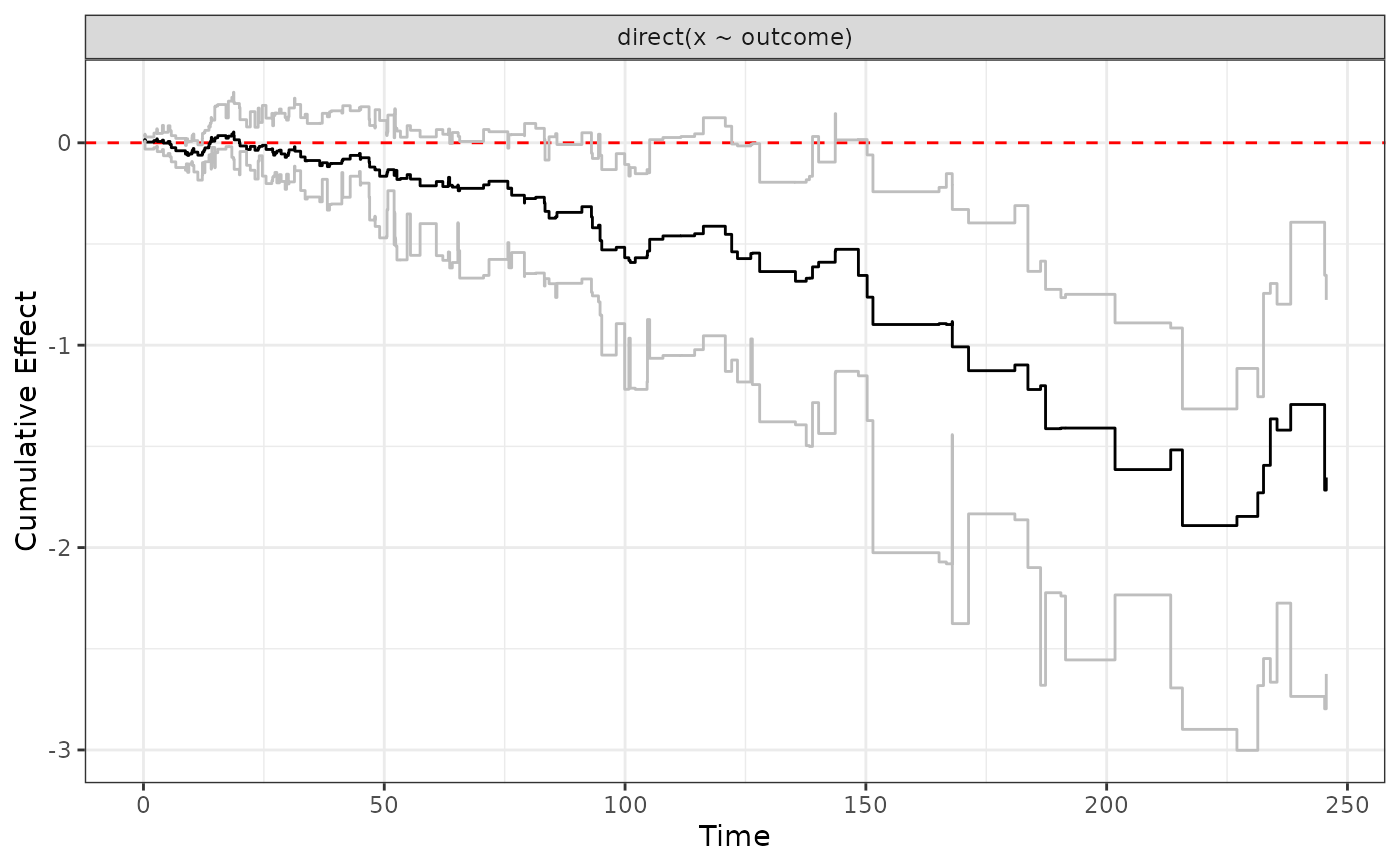
ggplot.effect(direct)
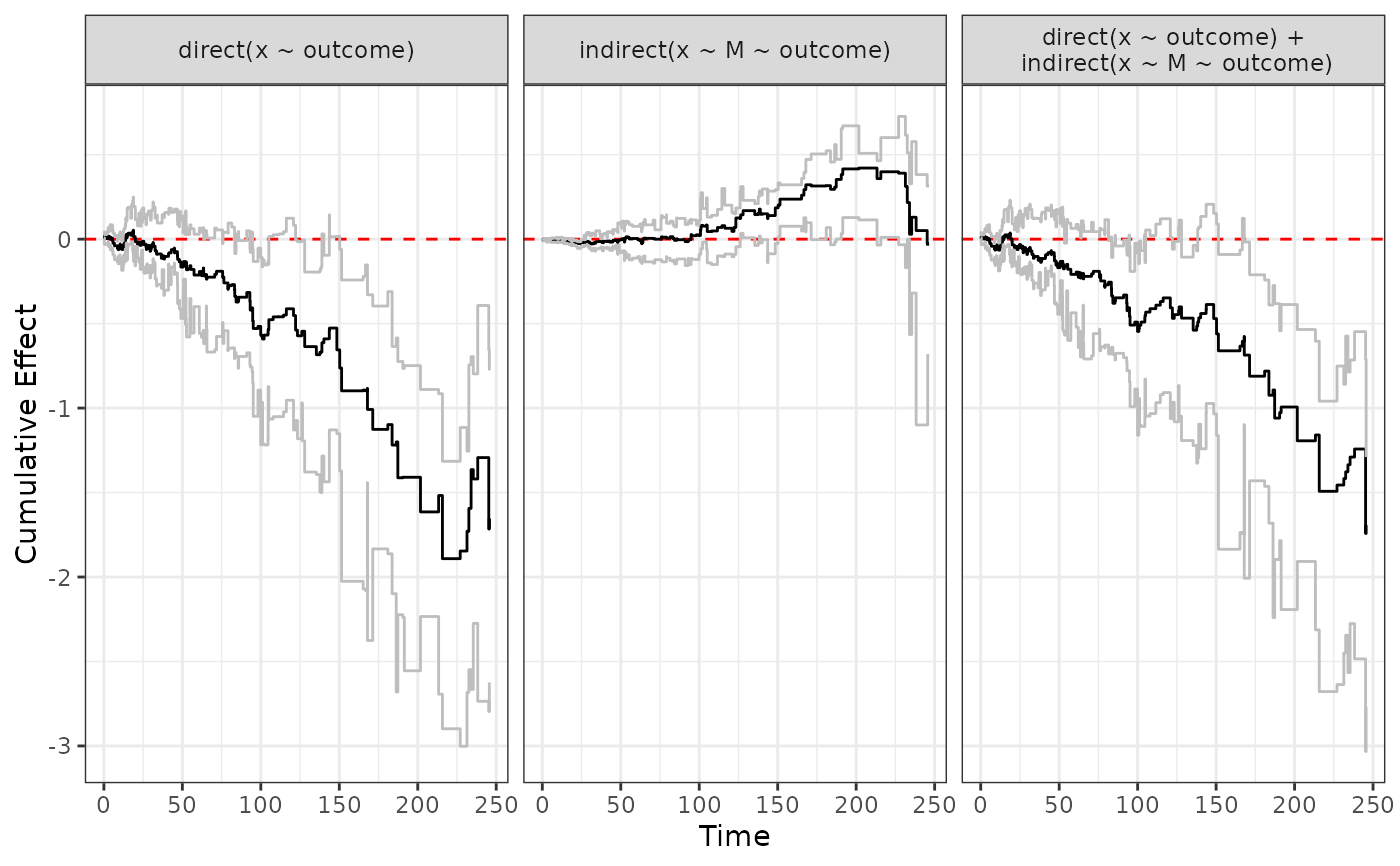
 ggplot.effect(list(direct, indirect, total))